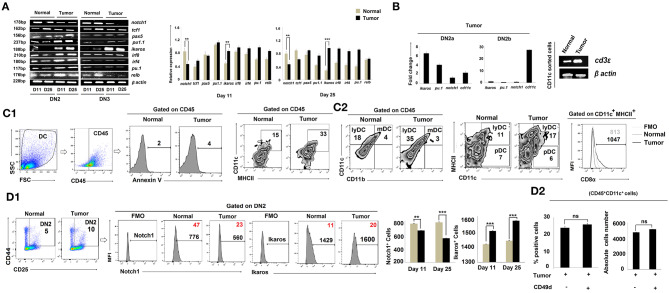
Figure 4.
Tumor microenvironment induces DC lineage commitment of DN2 pro-T cells. (A) Thymic T cells from normal and tumor hosts were sorted for CD25+CD44+ and CD25+CD44− cells as DN2 and DN3 by flow cytometry on days 11 and 25 after tumor inoculation. Different gene expressions for different transcription factors were checked by RT-PCR using mRNA from thymic T cells, keeping β-actin as a loading control. notch1 and tcf1 were checked for T cells, pax5 for B cells, pu1.1 for macrophages, and ikaros, irf8, irf4, pu.1, and relb for myeloid lineage commitment. Representative expression patterns of genes are presented in the left panel along with bar diagrams showing mean ± SE of expression of mentioned transcription factors from normal and tumor hosts on days 11 and 25, respectively (n = 4); **p < 0.01, ***p < 0.001. (B) Thymic T cells from normal and tumor hosts were sorted for CD25+CD44+c-Kithigh and CD25+CD44+c-Kitlow cells as DN2a and DN2b by flow-cytometry on day 25 after tumor inoculation. From the mRNA, different gene expressions were checked by quantitative real-time PCR, keeping β-actin as a housekeeping gene. Ct values were calculated, and fold change of Ct value against experimental control was represented by mean ± SE in a bar diagram (n = 3). The right panel shows the gene expression pattern of cd3ε from CD11c+-sorted thymic cells from normal and tumor hosts using β-actin as a loading control. (C1,C2) The total percentages of dendritic cells of normal and tumor-bearing mice were checked by flow cytometry. Thymic cells were stained with CD45, Annexin V, CD11c, MHCII, CD11b, and CD8α. Gating strategies of staining are shown, and flow-cytometric representations of CD45+CD11c+MHCII+, CD45+CD11b−CD11c+ (lymphoid DC), CD45+CD11b+CD11c+ (myeloid DC), CD11c+MHCIIhighCD8α+ (lymphoid DC), and CD11c+MHCIIlowCD8α+ (Plasmocytoid DC) cells reveal the number of total dendritic cells. (D1) Further validation of Notch1 and Ikaros expression was performed by flow cytometry along with DN2 (CD25, c-Kit) markers from thymic T cells. In histograms, positive percentages of cells are in red. Bar diagrams represent mean ± SE of percentage of DN2+Notch1+and DN2+Ikaros+ (n = 4) cells, respectively; **p < 0.01, ***p < 0.001. (D2) Increased population of thymus from tumor host was checked after CD49d treatment (4 doses with 48 h interval over a period of 8 days). CD45+CD11c+ dendritic-cell population of thymus from B16 tumor host with or without CD49d treatment was checked by flow cytometry. Bar diagrams represent mean ± SE of percentage positive CD45+CD11c+ dendritic-cell population (left panel) and absolute cell numbers (right panel) of CD45+CD11c+ thymic cells from tumor host.

