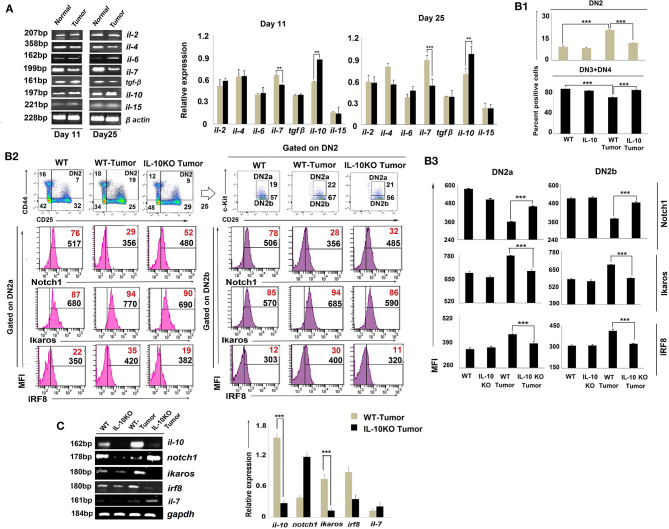
Figure 5.
IL-10 promotes tumor-induced early arrest of DN2 pro-T cells by reciprocal regulation of Notch1 and Ikaros signaling. (A) mRNA was isolated from thymi of normal and tumor hosts, and cytokine (il-2, il-4, il-6, il-7, il-10, il-15, and tgfβ) profiles were assessed by RT-PCR, keeping β-actin as a loading control. Representative figures of gene expression profile are shown in the left panel and bar diagrammatic representations of mean ± SE of relative expression of above-mentioned cytokines from normal and tumor hosts on days 11 and 25 following tumor inoculation, respectively, are shown in the right panel, n = 3; **p < 0.01, ***p < 0.001. (B1) Thymic T cells were isolated from non-tumor (wild-type and IL-10−/−) and tumor (wild-type and IL-10−/−) mice. DN2, DN3, and DN4 cells were stained with CD45, CD4, CD8, CD25, CD44, and c-Kit. Gating strategies are shown in Supplementary Figure 1. Bar diagrams represent the mean ± SE percentage of DN2 and DN3+DN4 positive cells from the above-mentioned mice, respectively. (B2) Representative figures of flow cytometric analysis performed with CD45, CD4, CD8, CD44, CD25, c-Kit, Ikaros, IRF8, and Notch1 in thymic T cells from wild-type and IL-10−/− tumor-bearing mice. Histograms show MFI and positive percentages of cells of DN2a+Notch1+, DN2a+ Ikaros+, DN2a+IRF8+ DN2b+Notch1+, DN2b+ and DN2b+IRF8+. (B3) Bar diagrams showing mean ± SE of MFI values of Notch1+, Ikaros+, and IRF8+ within DN2a and DN2b cells, respectively, from the mice mentioned in B2. (C) Cytokine and transcription factor profiles were assessed in sorted DN2 cells from non-tumor (wild-type and IL-10−/−) and tumor (wild-type and IL-10−/−) mice by analyzing il-10, notch1, ikaros, irf8, and il-7 gene expressions by RT-PCR, keeping gapdh as a loading control. Representative figures along with bar diagram show mean ± SE of different gene expressions from the above-mentioned mice. n = 4 in each group; p-values are mentioned in figure.

