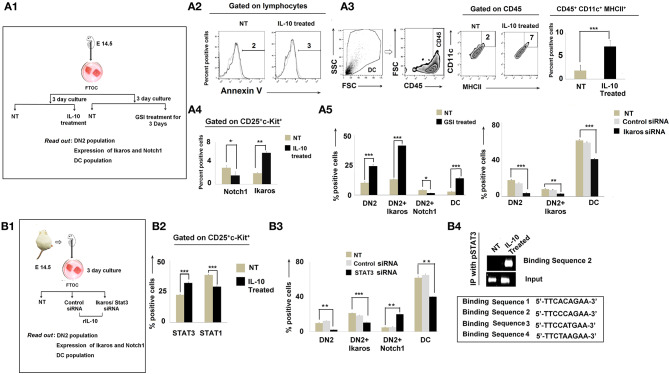
Figure 6.
IL-10 promotes DN2-to-dendritic cell lineage differentiation by Notch1/Ikaros signaling. (A1) Workflow diagram of the experimental design of fetal thymic organ culture (FTOC) using the fetuses of E14.5 pregnant mice. (A2) Total lymphocyte populations of FTOC were analyzed by Annexin V. Histograms of Annexin V+ flow-cytometry results. Dotted line represents the isotype control. (A3) Total dendritic-cell population was checked in FTOC ± IL-10 treatment cohort. Representations of flow-cytometry results of CD11c+MHCII+ cells, gated on CD45+ cells, and a bar diagram showing mean ± SE of percentage positive CD45+CD11c+MHCII+ cells from either untreated or IL-10-treated FTOC. n = 3; ***p < 0.001. (A4) Bar diagram to represent DN2+Notch1+ and DN2+Ikaros+ cells from ± IL-10-treated FTOC, n = 3; *p < 0.05, **p < 0.01 (A5) Bar diagrammatic representations of the mean ± SE of DN2+, DN2+Ikaros+, and DN2+Notch1+ cells and DC population from untreated and GSI-treated cohorts in left panel along with mean ± SE of DN2+, DN2+Ikaros+ cells, and CD45+CD11c+MHCII+ DC population from untreated, control siRNA-treated, and Ikaros siRNA-treated cohorts in right panel, n = 3; ***p < 0.001, **p < 0.01, *p < 0.05. (B1) Workflow representing STAT3 and Ikaros silencing experiments with FTOC. (B2) Bar diagrammatic representation of mean ± SE of percentage of DN2+STAT3+ and DN2+STAT1+ cells in ± IL-10-treated cohort, n = 3; ***p < 0.001 (B3) Flow-cytometric analysis was performed; bar diagram showing mean ± SE of percentage of DN2+, DN2+Ikaros+, DN2+ and CD45+CD11c+MHCII+ DC population from untreated, control siRNA-treated and STAT3 siRNA-treated cohorts, n = 3; ***p < 0.001, **p < 0.01. (B4) ChIP assay for pSTAT3 recruitment to the putative binding site downstream of the Notch1 promoter. Gene expression patterns of different binding sites show that upon IL-10 treatment, a specific binding site (binding sequence 2) of the downstream region of Notch1 promoter sequenced 5′ TTCCCAGAA 3′ becomes bound by pSTAT3 and Notch1 becomes downregulated.

