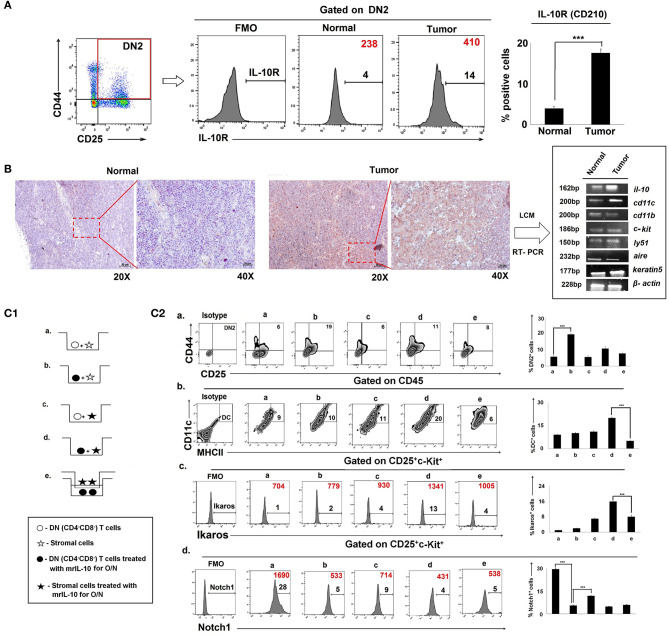
Figure 7.
Physical interaction between IL-10Rhigh T cells and stromal cells is required in tumor-induced early arrest and switching of DN2 pro-T cells toward DCs: (A) IL-10 receptors in thymic DN2 T cells are represented by flow-cytometric histograms (positive percentages are written in black, and MFI values are written in red). Bar diagram represents mean of positive percentages ± SE; n = 3, ***p < 0.001. (B) IL-10-rich zone in thymi of normal and tumor hosts was identified immunohistochemically. IL-10-rich regions, i.e., cortico-medullary region of thymus, are shown in 20 × and 40 × magnification, and these zones were isolated using a laser capture microscope to analyze the gene expression using mRNA by RT-PCR, keeping β-actin as a loading control. Genes include il-10, cd11c, cd11b, c-kit, ly51, aire, and keratin5 in samples from normal and tumor cohorts (n = 3 in each case). (C1) Pictorial diagram of experimental set up of T-cell and stromal-cell interaction. DN T cells were isolated by BD Imag, and stromal cells were isolated by 2-deoxyguanosine treatment in FTOC culture for 3 days. DN-T cells and stromal cells were then co-cultured in transwell with or without trans-membrane and IL-10 treatment. Different conditions are: (a) DN T cells were co-cultured with stromal cells, (b) DN T cells were pre-treated with mrIL-10 overnight and co-cultured with stromal cells, (c) stromal cells were pre-treated with mrIL-10 overnight and co-cultured with DN T cells, (d) stromal cells and DN T cells were pre-treated with mrIL-10 overnight and then co-cultured, (e) stromal cells and DN T cells pre-treated with mrIL-10 overnight, and then DN T cells co-cultured with stromal cells were separated with 0.8-μm trans-membrane in trans-well. (C2) Flow cytometric representations of thymic cells for (a) CD25+CD44+, (b) CD45+CD11c+MHCII+, (c) CD25+c-Kit+Ikaros+ (d) CD25+c-Kit+Notch1+ from (a–e) culture conditions as mentioned. In histograms, MFI values are represented in red, and positive percentages of cells are presented in black. Bar diagrams in each figure show the mean ± SE of 3 individual observations; ***p < 0.001.

