Abstract
Aim
Although electroencephalogram (EEG) seizure duration and seizure threshold change during a course of electroconvulsive therapy, the mechanisms by which these factors influence heart rate during subsequent electroconvulsive therapy sessions are currently unclear. In the current study, we investigated changes in heart rate during electroconvulsive therapy.
Methods
We recorded electroencephalography and electrocardiography during electroconvulsive therapy in 12 patients with major depressive disorder. Baseline heart rate was defined as the mean heart rate in the 30 seconds prior to stimulus onset. The TimeMax peak refers to the maximum heart rate after stimulus onset. Time1/2 points represent the time points at which the heart rate had decreased to a value midway between the baseline heart rate and the TimeMax peak. We examined the relationships between EEG seizure duration, TimeMax, and Time1/2 throughout the course of electroconvulsive therapy.
Results
Time1/2 decreased as the number of electroconvulsive sessions increased. Time1/2 was positively correlated with EEG seizure duration.
Conclusion
The duration in which electroconvulsive therapy‐induced sympathetic nervous system activation returned halfway to baseline levels gradually shortened during the course of electroconvulsive therapy.
Keywords: anticonvulsive effect, depression, electroconvulsive therapy, parasympathetic nervous activity, sympathetic nervous activity
We investigated heart rate as a reflection of autonomic nervous system activity changes during a course of electroconvulsive therapy (ECT) in patients with depression. We found that the amount of time required for the heart rate of the participants to return halfway to the baseline level was shortened during a course of ECT.

1. INTRODUCTION
Electroconvulsive therapy (ECT) is a safe and effective treatment for patients with major depressive disorder (MDD).1 However, the precise mechanisms underlying ECT remain unclear.2, 3
The anticonvulsant hypothesis4 describes one of several potential mechanisms for explaining the antidepressant effects of ECT.2, 3 Observations of progressive increases in seizure threshold and progressive decreases in seizure duration during the course of repeated ECT sessions support this hypothesis.5, 6, 7, 8, 9 The diencephalon hypothesis2, 10 is based on the premise that ECT‐induced seizures must be sufficiently generalized to involve the diencephalic centers implicated in the regulation and modulation of appetitive behaviors, diurnal rhythms, hormone release, and physiological homeostasis. Pollitt described the way in which the diencephalon directly controls a variety of biological functions frequently implicated in depression through its hypothalamic releasing factors, which involve the pituitary gland and autonomic nervous system (ANS).11 In addition, ECT procedures have been found to affect autonomic nervous activity, and diencephalon hyperactivity may induce these changes.12, 13 Although electroencephalogram (EEG) seizure duration and seizure threshold change during a course of ECT, to the best of our knowledge, no studies have examined whether the influence of these factors on ANS activity changes in subsequent ECT sessions.
We investigated ECT‐induced alterations of ANS and the relationship between ANS changes and seizure duration during a course of ECT.
2. METHODS
2.1. Participants
Twelve patients with MDD took part in this study (nine women; mean age ± standard deviation, 68.8 ± 7.3 years) (Table 1). All participants were diagnosed in accord with the Diagnostic and Statistical Manual of Mental Disorders, Fourth Edition, Text Revision (DSM‐IV‐TR).14 Exclusion criteria included cardiovascular, respiratory, endocrinological, or neurological illness, history of epilepsy, head injury, or drug abuse. Ten of the 12 patients received neurotropic agents during the course of ECT. Table 1 shows a comprehensive list of the psychopharmacological and antihypertensive medicine the participants received. This study was conducted in accordance with the Declaration of Helsinki (as revised in Brazil in 2013). We obtained written informed consent from all patients after a thorough explanation of the study procedures, and assured participants that patient anonymity would be preserved. The study procedures were approved by the Ethics Committee of Tokyo Medical and Dental University and the Ethics Committee of Tokyo Metropolitan Health and the Medical Corporation Toshima Hospital.
Table 1.
Demographic and clinical characteristics, number of electroconvulsive therapy (ECT) sessions, and changes in symptoms. We evaluated depressive symptoms using the Hamilton Depression Rating Scale (HAM‐D) at baseline <1 wk before the first ECT session (HAM‐D Pre ECT) and within 1 wk after one full ECT cycle (HAM‐D Post ECT)
| Gender | Age (y) | ECT number | HAM‐D Pre ECT | HAM‐D post ECT | Medication | |
|---|---|---|---|---|---|---|
| 1 | Female | 65 | 12 | 35 | 9 | Aripiprazole |
| 2 | Female | 66 | 13 | 28 | 0 | Sulpiride, trazodone, lorazepam, quetiapine |
| 3 | Female | 67 | 3 | 5 | 0 | Sertraline, olanzapine, bromazepam |
| 4 | Female | 68 | 14 | 27 | 16 | Mirtazapine, aripiprazole |
| 5 | Female | 68 | 10 | 19 | 1 | Olanzapine, duloxetine |
| 6 | Female | 69 | 5 | 31 | 19 | Free |
| 7 | Female | 74 | 13 | 18 | 7 | Trazodone, escitalopram, quetiapine |
| 8 | Female | 74 | 5 | 27 | 21 | Escitalopram |
| 9 | Female | 75 | 9 | 23 | 14 | Mirtazapine, sertraline |
| 10 | Male | 50 | 9 | 18 | 2 | Aripiprazole, mirtazapine, diazepam, olanzapine, trazodone, imipramine, escitalopram, levomepromazine |
| 11 | Male | 70 | 10 | 29 | 7 | Free |
| 12 | Male | 80 | 7 | 34 | 12 | Mianserin |
| Mean | 68.8 | 9.1 | 24.2 | 8.3 | ||
| SD | 7.3 | 3.5 | 8.8 | 7.4 |
ECT, electroconvulsive therapy; HAM‐D, Hamilton Depression Rating Scale; SD, standard deviation.
2.2. Procedures
2.2.1. Electroconvulsive therapy
Electroconvulsive therapy was performed 1‐3 times per week using a pulse wave machine (Thymatron System IV; Somatics LLC, Lake Bluff, IL, USA) with a brief pulse width of 0.5 milliseconds. The pulse wave frequency was 70 Hz. The stimulus duration was 4.3 ± 2.1 (2‐8) seconds, and the stimulus dose, adjusted according to previously described guidelines,15 was 276.4 ± 133.2 (100.8‐504) mC. We used bifrontal stimulus electrode placement in all ECT sessions. The stimulus electrodes were placed at the bilateral frontal poles. We used the half‐age method for determining initial stimulus dose, which is an age‐based formula that is widely used in Japan.16 We recorded seizure duration with a two‐channel EEG device at Fp1 and Fp2 in accordance with the International 10–20 system. The duration of EEG seizure activity was determined by two psychiatrists based on visual analysis using the EEG monitor attached to the ECT device as the time from the electrical stimulus to cessation to postictal EEG suppression. We administered intravenous thiopental (2‐4 mg/kg) as an anesthetic 5 minutes before stimulus onset, rocuronium (0.6‐1.3 mg/kg; n = 8) or suxamethonium (0.7‐1.2 mg/kg; n = 4) as a muscle relaxant 4 minutes before stimulus onset, and induced hyperventilation (15‐20/min) as per standard procedures.15 Doses of thiopental were kept constant among the sessions, although they varied between patients. Diltiazem (4‐5 mg; n = 4) or nicardipine (0.5 mg; n = 3) was injected immediately before application of the ECT stimulus to prevent an acute hyperdynamic response to ECT.
Atropine sulfate was not used. On the day of ECT, patients fasted, and refrained from taking oral medication in the morning. ECT sessions ranged in number from 3 to 14. We used psychotropic equivalents, specifically an imipramine equivalent and chlorpromazine equivalent, to evaluate the influence of antidepressants and antipsychotics, respectively.17
2.2.2. ECG recording
In each ECT session, we recorded electrocardiogram (ECG) data from 4 minutes before stimulus onset to 4 minutes after stimulus onset. ECG signals were recorded with a sampling rate of 1 kHz from two separate adhesive monitoring electrodes; one was placed at V5 (12‐Lead ECG) as the positive input, and the other was placed under the right clavicle as the reference to the CS5 lead. We used the LRR‐03 ECG recording system (GMS, Tokyo, Japan).
2.2.3. Heart rate
RR interval (RRI) data were obtained such that the 60/RRI equaled the heart rate (HR).
To examine changes in cardiac ANS activity during a course of ECT, we compared individual HR among the first, second, and third ECT sessions. The mean HR in the 30 seconds prior to stimulus onset was defined as the baseline HR. The T Max peaks were designated as the data points with the maximum HR between 0 and 4 minutes after stimulus onset. The T 1/2 point corresponded to the value halfway between the baseline HR and T Max HR (Figure 1). Because most patients underwent nine or more ECT sessions, we also investigated the evolution of T 1/2 in these patients among ECT sessions 1‐9.
Figure 1.
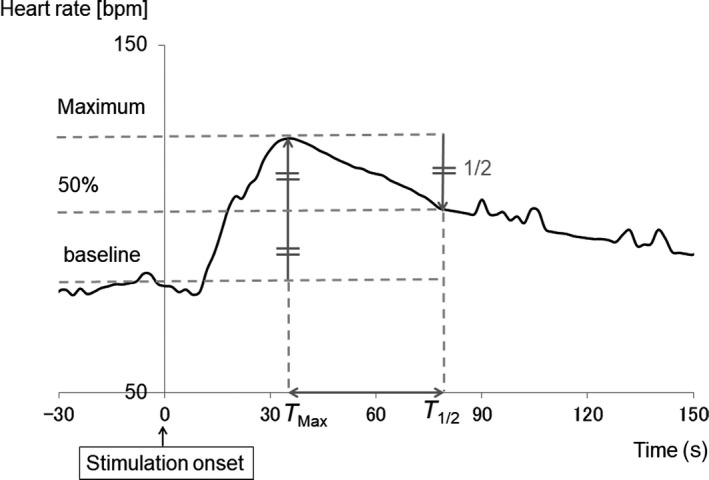
Baseline heart rate (HR), T Max, and T 1/2. The mean HR in the 30 s prior to stimulus onset was defined as baseline HR. The T Max peak was designated as the data point with the maximum HR value between 0 and 4 min after stimulus onset. The T 1/2 point was determined as the data point at which HR had decreased to halfway between the baseline HR and T Max of HR
2.2.4. Heart rate variability
RR interval fluctuation of ECG is termed heart rate variability (HRV). Power spectral analysis of HRV can be used to assess cardiac autonomic regulation.18 Efferent vagal activity is a major contributor to the high‐frequency (HF, 0.15‐0.4 Hz) component of the power spectrum, whereas the low‐frequency (LF, 0.04‐0.15 Hz) component is considered to include both sympathetic and parasympathetic activity.18 The LF/HF ratio is assumed to reflect sympathetic modulation.18 When examining ANS activity, we used the HRV to separately measure sympathetic and parasympathetic activity via the maximum entropy method in MemCalc BonalyLight real‐time analysis software (GMS, Japan). We calculated HRV parameters with a window width of 30 seconds, in 2‐second bins. We performed logarithmic transformation for the HF, LF, and LF/HF data.
2.3. Clinical evaluation
We evaluated depressive symptoms using the Hamilton Depression Rating Scale (HAM‐D)19 during the week before the first ECT session as the baseline measurement and within 1 week after one full ECT cycle (Table 1). We considered a greater than 50% decrease of HAM‐D scores from baseline to indicate a positive response to ECT treatment.
2.4. Statistical analysis
Because the smallest number of ECT sessions was three, we analyzed HRs from the first to the third ECT session. We used SPSS 18.0 for Windows (SPSS Inc., Chicago, IL, USA) for statistical analyses.
We first analyzed the mean values of EEG seizure duration, maximum HR, T 1/2, and T Max using a one‐way repeated‐measures analysis of variance (ANOVA) with ECT number as a within‐subjects factor. The Bonferroni test was used for post hoc analyses. We investigated the evolution of T 1/2 among ECT sessions 1‐9 in all participants using Spearman's regression analysis. For HRV analysis, we compared inter‐individual averaged waveforms for LF, HF, and LF/HF among the ECT sessions. We performed a within‐factor ANOVA (first vs second vs third ECT session) on LF, HF, and LF/HF for every 10‐second bin (in the range of −10‐0, 0‐10, 10‐20, …, 110‐120).
We used Spearman's correlation to examine the relationships between T Max, T 1/2 and the maximum HR, and EEG seizure duration. We conducted a paired t test to examine clinical improvement as reflected by HAM‐D scores before and after ECT. The relationships between maximum HR, T Max and T 1/2, and medication were also calculated using Spearman's correlation analysis. An alpha level of 0.05 was used for all analyses.
3. RESULTS
We assessed a total of 36 sets of ECT data (12 participants × 3 ECT sessions). The average stimulus dose for the 36 ECT sessions was 262.5 ± 132.7 mC, and the seizure threshold in the first to the third ECT sessions increased in three of the 12 patients. The stimulus dose was increased in three patients during the ECT sessions. The average EEG seizure duration was 61.7 ± 26.6 seconds. The EEG seizure duration tended to decrease as the number of ECT sessions increased. However, a one‐way ANOVA comparing EEG seizure duration indicated no main effect of ECT session.
3.1. Clinical evaluation
All patients exhibited significant clinical improvement after ECT (t = 6.97, P < 0.05). Furthermore, 66.7% of patients exhibited a reduction of more than 50% in terms of HAM‐D score from baseline. Spearman's correlation analyses indicated no correlations between HAM‐D, EEG seizure duration, and HR parameters.
3.2. HR parameters
An ANOVA revealed a significant main effect of ECT session on T 1/2 (F [2, 10] = 4.86, P < 0.05). The Bonferroni test revealed that T 1/2 was significantly lower in the second and third ECT sessions compared with that in the first session (Figure 2). Spearman's correlation analysis indicated a positive correlation between EEG seizure duration and T 1/2 (r s = 0.74, P < 0.05; Figure 3), suggesting that the shorter the EEG seizure duration, the more quickly HR decreased halfway to the baseline value. Spearman's correlation analysis also identified a positive correlation between EEG seizure duration and HRMax (r s = 0.56, P < 0.05), indicating that a longer EEG seizure duration was associated with a greater increase in HR. Spearman's correlation analysis revealed no correlation between EEG seizure duration and T Max. In addition, Spearman's correlation analyses clarified that T 1/2 was positively correlated with both the imipramine‐equivalent (r s = 0.40, P < 0.05) dose and the chlorpromazine‐equivalent (r s = 0.41, P < 0.05) dose. We found no correlations between medication dose and HRMax or T Max.
Figure 2.
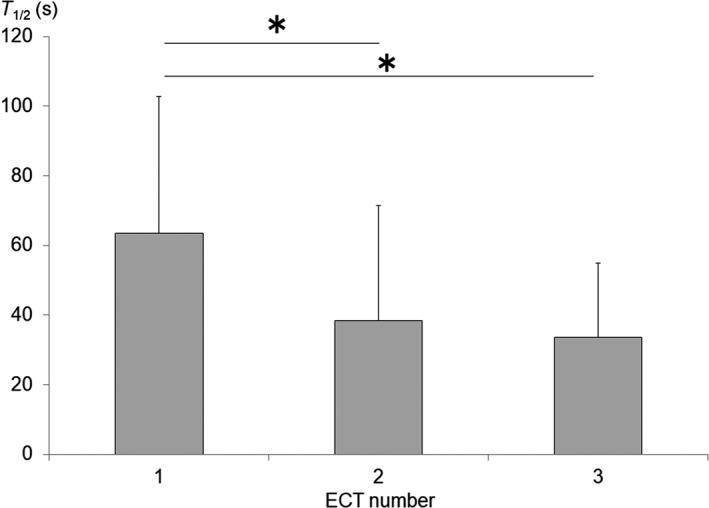
Changes in T 1/2 duration during the course of electroconvulsive therapy (ECT). T 1/2 decreased with the number of ECT sessions (*P < 0.05)
Figure 3.
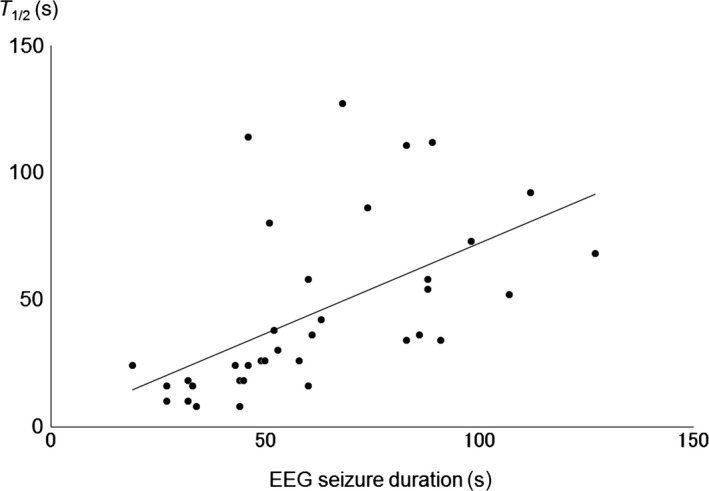
Correlation between electroencephalogram (EEG) seizure duration and T 1/2. T 1/2 was positively correlated with EEG seizure duration (r s = 0.74, P < 0.05)
When we investigated the evolution of T 1/2 among sessions 1‐9 in patients who underwent at least nine ECT sessions, we found that T 1/2 significantly decreased with ECT repetition (regression analysis; r s = 0.75, P < 0.05) (Figure 4). The largest drop in T 1/2 along the ECT sessions occurred between the first and second ECT treatments. Beyond that, T 1/2 consistently and gradually decreased.
Figure 4.
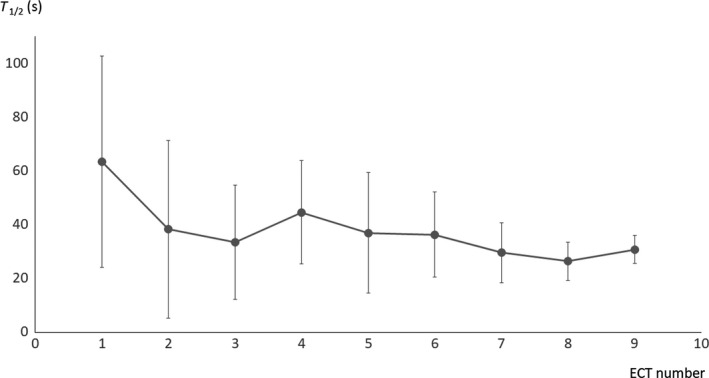
Evolution of T 1/2 in patients among nine electroconvulsive therapy (ECT) sessions. T 1/2 was negatively correlated with ECT sessions (r s = 0.75, P < 0.05)
3.3. HRV parameters
We visually inspected the inter‐individual averaged HRV waveform in ECT sessions 1‐3 (Figures 5, 6, 7). The period 70‐90 seconds after the ECT stimulus is considered to be the third component of the triphasic ANS change that occurs after ECT stimulation (parasympathetic–sympathetic–parasympathetic nervous activity). The HF component in this period increased with the number of ECT sessions. Additionally, activity during this period tended to differ substantially (Figure 6) among the ECT sessions. An ANOVA revealed no significant effect of “time” (ie, the number of ECT sessions) as a main factor.
Figure 5.
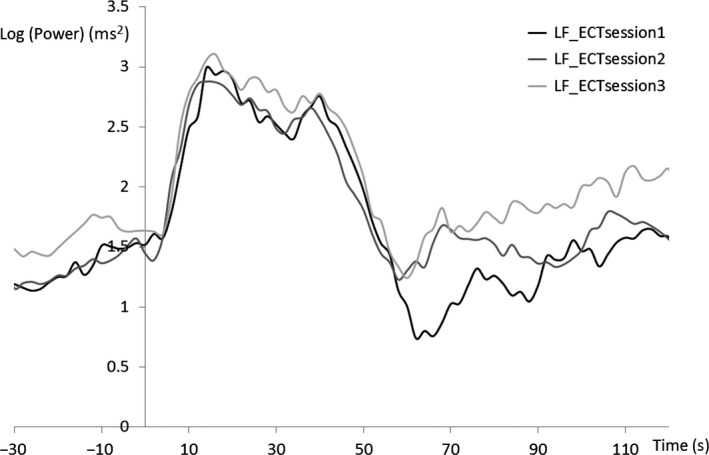
Grand average of heart rate variability during low‐frequency (LF) ECT
Figure 6.
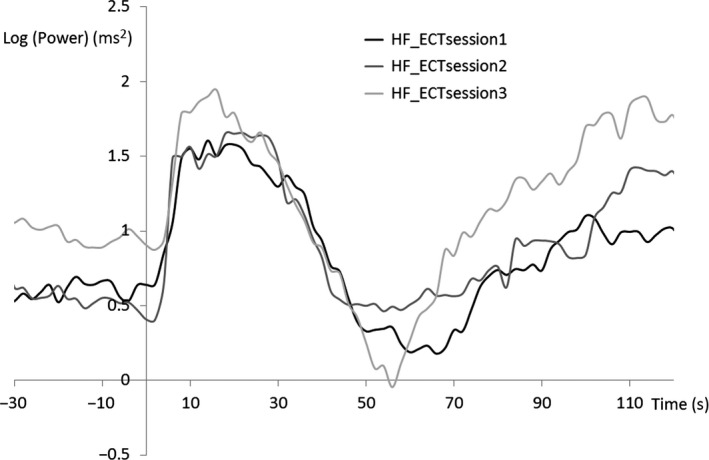
Grand average of heart rate variability during high‐frequency (HF) ECT
Figure 7.
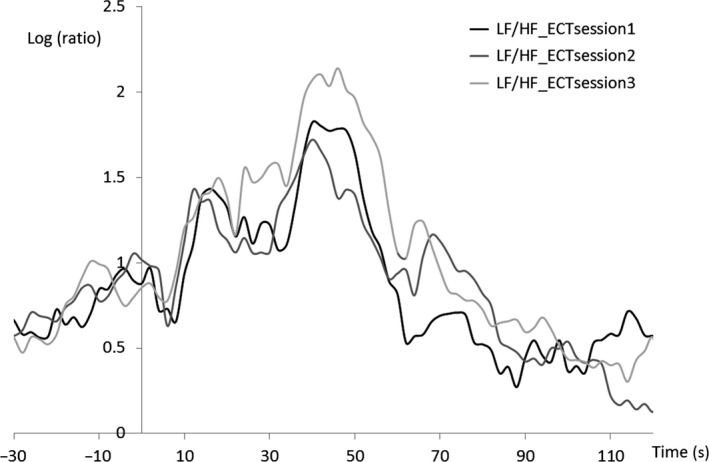
Grand average of heart rate variability during low‐frequency (LF)/high‐frequency (HF) ECT
4. DISCUSSION
We found that the T 1/2 of HR decreased as the number of ECT sessions increased. Additionally, the shorter the ECT seizure duration, the more quickly HR returned to the baseline value.
The observed correlation between T 1/2, peak HR, and seizure duration indicates that although the change in seizure duration did not reach significance, the T 1/2 and the reduction in the maximum HR may be related to the shortened duration of the ECT‐induced seizure. Because reduced seizure duration is an index of anticonvulsant activity,8, 20 the different seizure lengths in the EEG that are associated with ECT treatment efficacy may reflect individual diversity in the strength of the inhibitory processes that terminate the seizure. Such information could help to isolate biological variability that may predispose an individual to a positive or negative clinical response to ECT.21
In previous studies, hemodynamic parameters such as blood pressure (BP), HR, and rate pressure product (RPP, defined as HR multiplied by systolic BP) have been described as a class of possible physiological markers and have been examined in terms of their relationship to the therapeutic efficacy of ECT.22, 23 If the impact of a cerebral seizure on the diencephalon is related to ECT efficacy, then BP, HR, and RPP may reflect different aspect of efficacy with respect to EEG seizure activity, which primarily reflects cortical activity.22 The current finding that T 1/2 was significantly decreased with subsequent ECT sessions suggests that the cardiovascular index may be associated with the anticonvulsant effect of multiple ECT sessions. This phenomenon has repeatedly been shown in previous reports.6, 7, 8
Heart rate and HRV analyses in previous studies have revealed that autonomic nervous activity changes triphasically after ECT, such that changes in parasympathetic, sympathetic, and parasympathetic nervous activity occur after exposure to ECT stimuli.12, 24 Therefore, the observed reduction of T 1/2 in the HR data, elicited by subsequent ECT sessions, can be interpreted in terms of (a) an earlier decrease in sympathetic nervous system (SNS) activity (second phase) or (b) an earlier increase in parasympathetic nervous system (PNS) activity (third phase) with successive ECT sessions. Previous studies have reported that the therapeutic outcomes of ECT are related to parasympathetic nervous activity recovery.25, 26 Bär et al25 hypothesized that PNS activity following SNS activity elicited by ECT stimulation may be related to the therapeutic mechanisms of ECT. Specifically, earlier increases in PNS activity as the result of repeated ECT sessions may be associated with the therapeutic outcomes of ECT. We found that cardiac autonomic nervous activity tended to exhibit an abrupt pattern of change among the ECT sessions, particularly in terms of indicators of PNS activity. These data appear to support our hypothesis that an earlier onset of parasympathetic nervous activity as a result of repeated ECT sessions may be associated with the therapeutic outcomes of ECT. Additionally, these data appear to support our proposal that the 3rd phase of ANS change, in which parasympathetic nervous activity increases, may be related to the clinical efficacy of ECT.24 Future studies are needed to explore whether earlier decreases in SNS activity or earlier increases in PNS activity could act as predictors of therapeutic outcome and/or might be useful in determining the optimal number of ECT sessions.
Hyperventilation gives rise to an increase in PO2 and a fall in PCO2 and may improve the quality of ECT‐induced convulsions as well as the safety of ECT.27, 28, 29, 30, 31 Hyperventilation prior to ECT stimulation lowers the convulsive threshold, and 100% oxygenation is recommended.30 Both hyperoxidation and hypocapnia prior to stimulation are beneficial for preventing ECT failure and improving the quality of convulsions.27, 29, 31, 32, 33 Similarly, hyperventilation may contribute to the reduction of T 1/2. However, because all of our T 1/2 data were associated with hyperventilation, the direct effect of hyperventilation on the reduction of T 1/2 remains unclear.
The current study involved several limitations that should be considered when interpreting our results. In the current study, patients received a variety of medications during the course of ECT. A previous study reported that patients with MDD exhibit profound autonomic dysfunction, which is exacerbated by selective serotonin reuptake inhibitors and serotonin–norepinephrine reuptake inhibitors.34 We were not able to remove the anticonvulsive effects of thiopental in the current study. Second, we could not exclude the effects of antihypertensive medications in several patients during ECT. Previous studies have reported that diltiazem causes a reduction in HR and seizure duration 33, 34, 35 and that nicardipine accelerates the increase in HR after ECT stimulation.34, 35, 36 We were unable to control the use of antihypertensive medications between the 1st and 3rd ECT sessions in three patients.
The time required for ECT‐induced sympathetic nervous activation, as reflected by HR, to return halfway to baseline was shortened during a course of ECT.
CONFLICT OF INTEREST
The authors declare no conflict of interest.
DATA REPOSITORY
Datasets are available directly in the [Link], [Link], [Link], [Link], [Link], [Link], [Link].
APPROVAL OF THE RESEARCH PROTOCOL BY AN INSTITUTIONAL REVIEWER BOARD
The study procedures were approved by the Ethics Committee of Tokyo Medical and Dental University and the Ethics Committee of Tokyo Metropolitan Health and the Medical Corporation Toshima Hospital.
INFORMED CONSENT
We obtained written informed consent from all patients after a thorough explanation of the study procedures, and assured participants that patient anonymity would be preserved.
REGISTRY AND THE REGISTRATION NO. OF THE STUDY/TRIAL
The Ethics Committee of Tokyo Medical and Dental University (# 1104) and the Ethics Committee of Tokyo Metropolitan Health and Medical Corporation Toshima Hospital (# 28‐10).
ANIMAL STUDIES
N/A.
AUTHOR CONTRIBUTIONS
YS, M Miyajima, and KO conceived and designed the study and wrote the protocol. YS, M Miyajima, KO, NY, TW, MF, MO, and MN managed the acquisition and analysis of data. YS performed statistical analyses and wrote the first draft of the manuscript, figures, and table. M Miyajima, KO, TS, TK, M Matsuura, and EM critically revised the manuscript. All authors contributed to and have approved the final manuscript.
Supporting information
ACKNOWLEDGMENTS
The authors are grateful to the hospital staff at Tokyo Metropolitan Health and Medical Corporation Toshima Hospital. We thank Benjamin Knight, MSc., from Edanz Group (www.edanzediting.com/ac) for editing a draft of this manuscript.
Suzuki Y, Miyajima M, Ohta K, et al. Changes in cardiac autonomic nervous system activity during a course of electroconvulsive therapy. Neuropsychopharmacol Rep. 2019;39:2–9. 10.1002/npr2.12037
REFERENCES
- 1. Folkerts HW, Michael N, Tölle R, Schonauer K, Mücke S, Schulze‐Mönking H. Electroconvulsive therapy vs. paroxetine in treatment‐resistant depression – a randomized study. Acta Psychiatr Scand. 1997;96:334–42. [DOI] [PubMed] [Google Scholar]
- 2. Abrams R. Electroconvulsive therapy. 4th ed New York, NY: Oxford University Press; 2002. [Google Scholar]
- 3. McCall WV, Andrade C, Sienaert P. Searching for the mechanism(s) of ECT's therapeutic effect. J ECT. 2014;30(2):87–9. [DOI] [PMC free article] [PubMed] [Google Scholar]
- 4. Sackeim HA. The anticonvulsant hypothesis of the mechanism of action of ECT: current status. J ECT. 1999;15:5–26. [PubMed] [Google Scholar]
- 5. Andrade C, Gangadhar BN, Subbakrishna DK, Pradhan N. A double‐blind comparison of sinusoidal wave and brief‐pulse electroconvulsive therapy in endogenous depression. Convuls Ther. 1988;4:297–305. [PubMed] [Google Scholar]
- 6. Kales H, Raz J, Tandon R, et al. Relationship of seizure duration to antidepressant efficacy in electroconvulsive therapy. Psychol Med. 1997;27:1373–80. [DOI] [PubMed] [Google Scholar]
- 7. Lalla FR, Milroy T. The current status of seizure duration in the practice of electroconvulsive therapy. Can J Psychiatry. 1996;41:299–304. [DOI] [PubMed] [Google Scholar]
- 8. Rasimas JJ, Stevens SR, Rasmussen KG. Seizure length in electroconvulsive therapy as a function of age, sex, and treatment number. J. ECT. 2007;23:14–6. [DOI] [PubMed] [Google Scholar]
- 9. Krystal AD, Coffey CE, Weiner RD, Holsinger T. Changes in seizure threshold over the course of electroconvulsive therapy affect therapeutic response and are detectable by ictal EEG ratings. J Neuropsychiatry Clin Neurosci. 1998;10:178–86. [DOI] [PubMed] [Google Scholar]
- 10. Abrams R, Taylor MA. Diencephalic stimulation and the effects of ECT in endogenous depression. Br J Psychiatry. 1976;29:482–5. [DOI] [PubMed] [Google Scholar]
- 11. Pollitt JD. Suggestions for a physiological classification of depression. Br J Psychiatry. 1965;111:122–4. [Google Scholar]
- 12. Beyer JL, Weiner RD, Glenn MD. Seizure monitoring: the cardiovascular response. Electroconvulsive therapy. A programmed text. 2nd ed Washington, DC: American Psychiatric Press; 1998. [Google Scholar]
- 13. Takano H, Motohashi N, Uema T, et al. Differences in cerebral blood flow between missed and generalized seizures with electroconvulsive therapy: a positron emission tomographic study. Epilepsy Res. 2011;97:225–8. [DOI] [PubMed] [Google Scholar]
- 14. American Psychiatric Association . Diagnostic and statistical manual of mental disorders. 4th ed Text Revision (DSM‐IV‐TR). Washington, DC and London: American Psychiatric Association Press;;2000. [Google Scholar]
- 15. Mankad MV, Beyer JL, Weiner RD, Krystal AD. Clinical manual of electroconvulsive therapy. 1st ed Washington, DC: American Psychiatric Association press; 2010. [Google Scholar]
- 16. Yasuda K, Kobayashi K, Yamaguchi M, et al. Seizure threshold and the half‐age method in bilateral electroconvulsive therapy in Japanese patients. Psychiatry Clin Neurosci. 2015;69:49–54. [DOI] [PubMed] [Google Scholar]
- 17. Inada T, Inagaki A. Psychotropic dose equivalence in Japan. Psychiatry Clin Neurosci. 2015;69:440–7. [DOI] [PubMed] [Google Scholar]
- 18. Task Force of the European Society of Cardiology and the North American Society of Pacing and Electrophysiology . Heart rate variability: standards of measurement, physiological interpretation and clinical use. Circulation. 1996;93:1043–65. [PubMed] [Google Scholar]
- 19. Hamilton M. A rating scale for depression. J Neurol Neurosurg Psychiatry. 1960;23:56–62. [DOI] [PMC free article] [PubMed] [Google Scholar]
- 20. Sackeim HA, Decina P, Prohovnik I, Portnoy S, Kanzler M, Malitz S. Dosage, seizure threshold, and the antidepressant efficacy of electroconvulsive therapy. Ann NY Acad Sci. 1986;1462:398–410. [DOI] [PubMed] [Google Scholar]
- 21. Perera TD, Luber B, Nobler MS, Prudic J, Anderson C, Sackeim HA. Seizure expression during electroconvulsive therapy: relationships with clinical outcome and cognitive side effects. Neuropsychopharmacology. 2004;29:813–25. [DOI] [PubMed] [Google Scholar]
- 22. Azuma H, Fujita A, Sato K, et al. Postictal cardiovascular response predicts therapeutic efficacy of electroconvulsive therapy for depression. Psychiatry Clin Neurosci. 2007;61:290–4. [DOI] [PubMed] [Google Scholar]
- 23. Swartz CM. Physiological response to ECT stimulus dose. Psychiatry Res. 2000;97:229–35. [DOI] [PubMed] [Google Scholar]
- 24. Suzuki Y, Miyajima M, Ohta K, et al. A triphasic change of cardiac autonomic nervous system during electroconvulsive therapy. J ECT. 2015;31(3):186–91. [DOI] [PubMed] [Google Scholar]
- 25. Bär KJ, Ebert A, Boettger MK, et al. Is successful electroconvulsive therapy related to stimulation of the vagal system? J Affect Disord. 2010;25:323–9. [DOI] [PubMed] [Google Scholar]
- 26. Ebert A, Jochum T, Ritter J, et al. Does parasympathetic modulation prior to ECT treatment influence therapeutic outcome? Prog Neuropsychopharmacol Biol Psychiatry. 2010;34:1174–80. [DOI] [PubMed] [Google Scholar]
- 27. Loo C, Simpson B, MacPherson R. Augmentation strategies in electroconvulsive therapy. J ECT. 2010;26:202–7. [DOI] [PubMed] [Google Scholar]
- 28. Loo C, Kail A, Paton P, Simpson B. The difficult‐to‐treat electroconvulsive therapy patient: strategies for augmenting outcomes. J Affect Disord. 2010;124:219–27. [DOI] [PubMed] [Google Scholar]
- 29. Haeck M, Gillman B, Janouschek H, Grözinger M. Electroconvulsive therapy can benefit from controlled hyperventilation using a laryngeal mask. Eur Arch Psychiatry Clin Neurosci. 2011;261(Suppl. 2):S172–6. [DOI] [PubMed] [Google Scholar]
- 30. Sawayama E, Takahashi M, Inoue A, et al. Moderate hyperventilation prolongs electroencephalogram seizure duration of the first electroconvulsive therapy. J. ECT. 2008;25:195–8. [DOI] [PubMed] [Google Scholar]
- 31. Aksay SS, Bumb JM, Janke C, Hoyer C, Kranaster L, Sartorius A. New evidence for seizure quality improvement by hiperoxia and mild hypocapnia. J ECT. 2014;30:287–91. [DOI] [PubMed] [Google Scholar]
- 32. Datto C, Rai AK, Ilivicky HJ, Caroff SN. Augmentation of seizure induction in electroconvulsive therapy: a clinical reappraisal. J ECT. 2002;18:118–25. [DOI] [PubMed] [Google Scholar]
- 33. Saito S, Kadoi Y, Nishihara F, Aso C, Goto F. End‐tidal carbon dioxide monitoring stabilized hemodynamic changes during ECT. J ECT. 2002;18:118–25. [DOI] [PubMed] [Google Scholar]
- 34. Bär KJ, Greiner W, Jochum T, Friedrich M, Wagner G, Sauer H. The influence of major depression and its treatment on heart rate variability and pupillary light reflex parameters. J Affect Disord. 2004;82:245–52. [DOI] [PubMed] [Google Scholar]
- 35. Wajima Z, Yoshikawa T, Ogura A, et al. The effects of diltiazem on hemodynamics and seizure duration during electroconvulsive therapy. Anesth Analg. 2001;92(5):1327–30. [DOI] [PubMed] [Google Scholar]
- 36. Avramov MN, Stool LA, White PF, Husain MM. Effects of nicardipine and labetalol on the acute hemodynamic response to electroconvulsive therapy. J Clin Anesth. 1998;10(5):394–400. [DOI] [PubMed] [Google Scholar]
Associated Data
This section collects any data citations, data availability statements, or supplementary materials included in this article.
Supplementary Materials


