Figure 2.

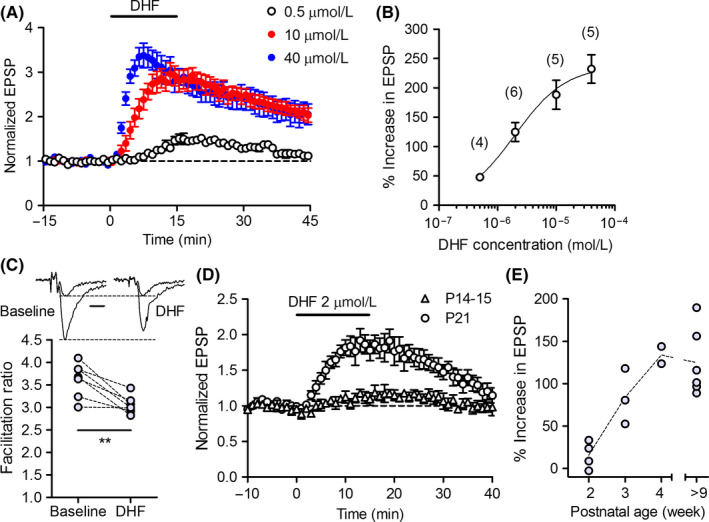
Characterization of DHF‐induced synaptic potentiation at mossy fiber synapse. A, Synaptic potentiation induced by different concentrations of DHF. B, Concentration dependence of DHF‐induced potentiation. The peak magnitude of synaptic potentiation is plotted against DHF concentrations. The number (n) of data is indicated in parenthesis in the graph. C, Reduction in synaptic facilitation by DHF. The magnitude of synaptic facilitation induced by triple‐pulse stimulation before and during DHF (2 μmol/L) application is shown (paired t test, t 6 = 4.187, **P = 0.0058, n = 7). Sample traces show the first and third responses of triple pulse‐evoked EPSPs scaled by the amplitude of the first EPSPs. Scale bar: 5 ms. D, Reduced DHF‐induced synaptic potentiation in juvenile mice. E, Dependence of the magnitude of DHF‐induced potentiation on the postnatal age of mice
