
Figure 2.
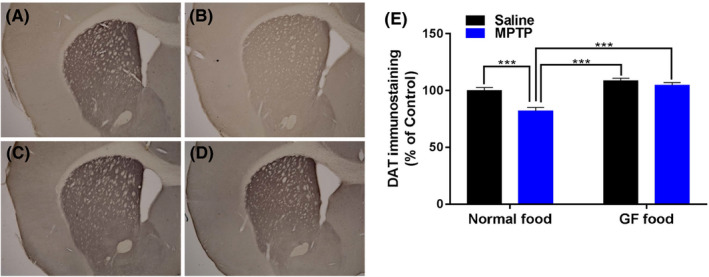
Effects of dietary intake of 0.1% GF on the reduction in the DAT density in the striatum after the repeated administration of MPTP. A, Control food pellet + Saline, B, Control food pellet + MPTP, C, 0.1% GF food pellet + Saline, D, 0.1% GF food pellet + MPTP. Representative photomicrographs showing the DAT‐immunoreactivity in the striatum of mice (A‐D). The mean value for DAT‐immunoreactivity staining was determined for each group and was expressed as a percentage of that of control mice (E). Each value is the mean ± SEM (n = 9‐11 per group). ***P < 0.001 as compared with the normal food + MPTP group