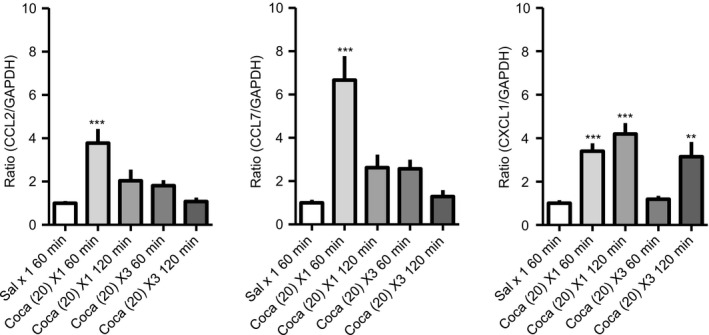
Figure 1.

The mRNA expression levels of CC chemokine ligand 2 (CCL2), CCL7, and CXC chemokine ligand 1 (CXCL1) in the prefrontal cortex (PFC) after cocaine (Coca) administration. The PFC samples were collected at indicated time point after a single administration of Coca (20 mg/kg, s.c.) or saline (Sal), and after a repeated administration of Coca (20 mg/kg, s.c., once a day for 3 days). The mRNA expression levels of CCL2, CCL7, and CXCL1 in the PFC were evaluated by RT‐qPCR. Each column shows the mean intensity ratio to GAPDH, and the data are presented as the mean ± SEM of 6‐12 mice. [F(4, 36) = 14.77], **P < .01, ***P < .001 vs Sal
