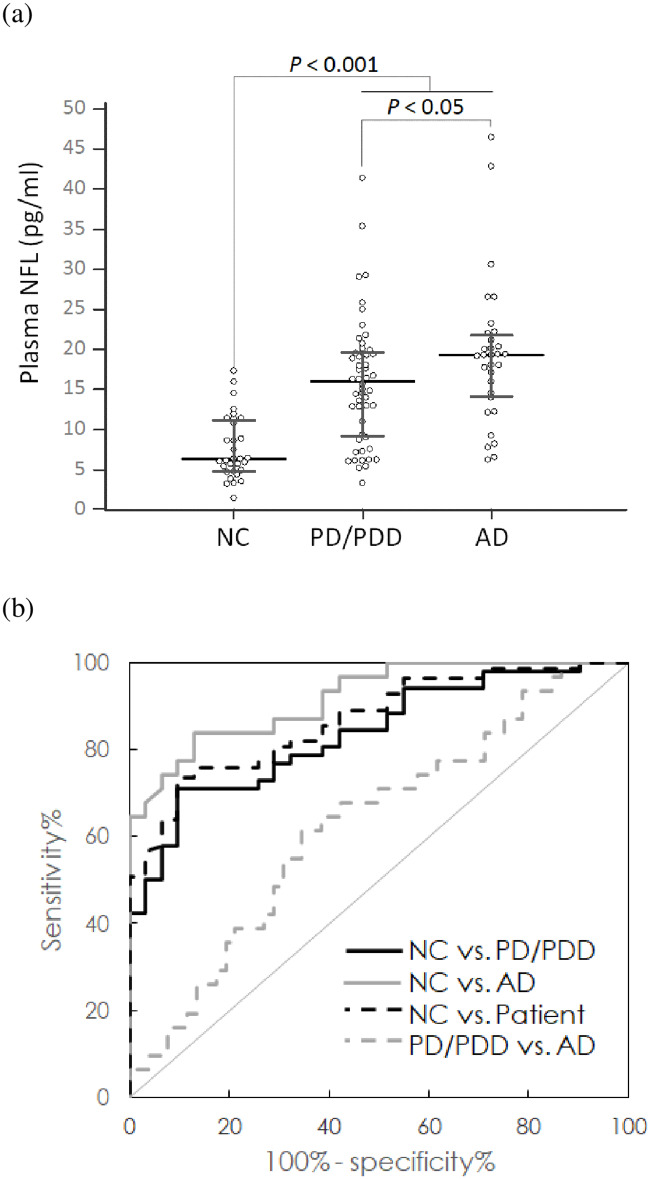
Fig 3. (A) Measured NFL concentrations in human plasma using IMR and (B) ROC curves used for differentiating various diagnostic groups (NC: Normal control, PD: Parkinson’s disease, PDD: Parkinson’s disease dementia, AD: Alzheimer’s disease, dementia: PD/PDD+AD).
The horizontal line represents median and the range of error bar represents interquartile range.

