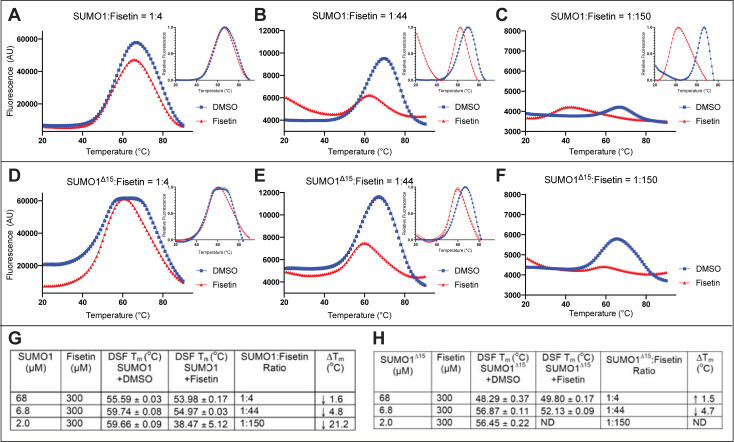
Fig 5. Differential scanning fluorimetry (DSF) reveals concentration-dependent unfolding of SUMO1 and SUMO1Δ15 by fisetin.
(A-C) Human SUMO1 (68.3 μM, 6.83 μM, or 2 μM) was treated with a DMSO control or fisetin (300 μM in DMSO), giving molar ratios of SUMO1 to fisetin of 1:4, 1:44, and 1:150, respectively. (D-F) The same treatment was performed with SUMO1Δ15. (A-E) Relative fluorescence plots are shown in insets. (F) Relative fluorescence was not determined (ND). (G,H) Quantification of DSF data plotted in representative graphs (A-F). As the ratio of SUMO1 to fisetin decreases, increased unfolding is observed for both wild type (SUMO1) and mutant (SUMO1Δ15). See Table 1 and S2 Fig in S1 Appendix.

