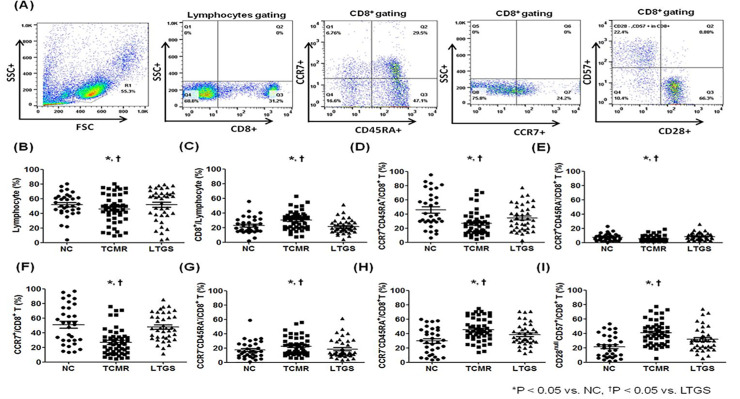
Fig 1. Comparison of CD8+ T cell subset among NC, TCMR and LTGS groups.
(A) PBMCs were stained with anti-CD8–APC, anti-CCR7 strepavidin, anti-CD45RA FITC, anti-CD28-PE and anti-CD57-FITC antibodies. CD8+ T cells were gated for further analysis. (B-I) Proportion (%) of (B) Lymphocytes, (C) CD8+ T cells/lymphocytes, (D) CCR7+CD45RA+CD8+ T cells, (E) CCR7+CD45RA-CD8+ T cells, (F) CCR7+CD8+ T cells, (G) CCR7-CD45RA-CD8+ T cells, (H) CCR7-CD45RA+CD8+ T cells, (I) CD28null CD57+CD8+ T cells in each patient group. *p < 0.05 vs. NC, †p < 0.05 vs. LTGS. Abbreviations; LTGS, long-term graft survival; NC, Normal control; TCMR, T cell mediated rejection.

