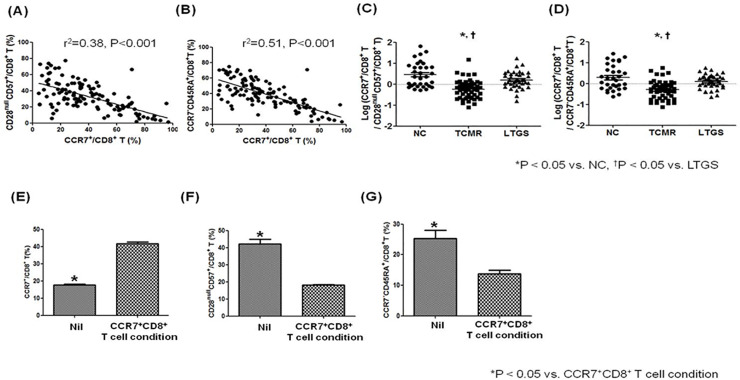
Fig 2. Association between CCR7+/CD8+ T cells and effector T cell subsets in an in vitro and in an ex vivo study.
PBMCs were stained with anti-CD8–APC, anti-CCR7 strepavidin, anti-CD45RA FITC, anti-CD28-PE and anti-CD57-FITC antibodies. Lymphocytes were gated for further analysis. (A) The proportion (%) of CCR7+CD8+ T cells showed a significant negative correlation with the proportion (%) of CD28null CD57+CD8+ T cells (p < 0.001, r2 = 0.38). (B) The proportion (%) of CCR7+CD8+ T cells showed a significant negative correlation with the proportion (%) of CCR7-CD45RA+CD8+ T cells (p < 0.001, r2 = 0.51). (C) Comparison of log (CCR7+CD8+ T cells / CD28nullCD57+CD8+ T cells) in each patient group. (D) Comparison of log (CCR7+CD8+ T / CCR7-CD45RA+CD8+ T cells) in each patient group * p < 0.05 vs. NC, † p < 0.05 vs. LTGS. In an in vitro study on CCR7+CD8+ T cells induction protocol, PBMCs were collected from healthy individuals, plated at 2 × 10⁵ cells per well, and stimulated with anti-CD3 Abs (0.1 μg/ml), recombinant IL-15 (20 ng/ml), IL-2 (20 ng/ml), and retinoic acid (1 μg/ml). On day 3, cells were harvested, stained with antibodies specific to CD8, CCR7, CD45RA, CD28 and CD57, and analyzed by flow cytometry. (E) Proportion (%) of CCR7+CD8+ T cells, (F) Proportion (%) of CD28nullCD57+CD8+ T cells, (G) Proportion (%) of CCR7-CD45RA+CD8+ T cells on CCR7+CD8+ T cells induction protocol. Bars represent the median with range. *p < 0.05 vs. CCR7+CD8+ T cell condition. Abbreviations; LTGS, long-term graft survival; NC, Normal control; TCMR, T cell mediated rejection.

