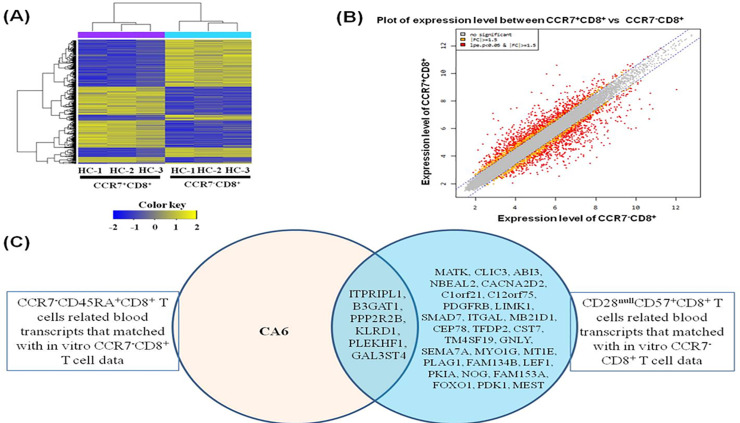
Fig 3. Gene expression in CCR7+CD8+ T cells and CCR7-CD8+ T cells using microarray.
(A) Hierarchical clustering of gene expression in CCR7+CD8+ T cells and CCR7-CD8+ T cells. Heatmap is showing 992 significantly (p < 0.05) differently expressed transcripts between CCR7+CD8+ T cells and CCR7-CD8+ T cells in three donors. The 992 genes were selected for this analysis by the criteria described in Materials and Methods. Expression levels are normalized for each gene and shown by color, with yellow representing high expression and blue representing low expression. (B) Scatter plot of expression level between CCR7+CD8+ T cells and CCR7-CD8+ T cells. (C) The overlap between the genes expressed on ex vivo CCR7-CD45+CD8+ T cells matched with in vitro CCR7-CD8+ T cell data and CD28nullCD57+CD8+ T cells related blood transcripts that matched with in vitro CCR7-CD8+ T cell data.

