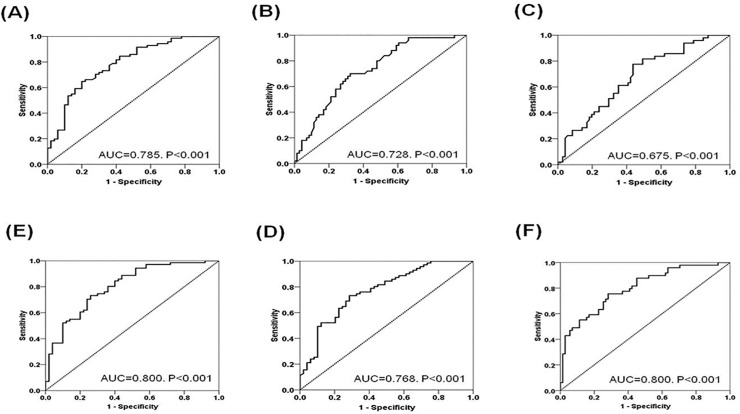
Fig 4. Receiver operating characteristics curves to evaluate the discriminative power of the combination of CD8+ T cell subsets in distinguishing TCMR from the NC or LTGS groups.
(A) CCR7+CD8+ T (B) CD57+CD28nullCD8+ T (C) CD45RA+CCR7-CD8+ T (D) The ratio between CCR7+CD8+ T vs CD28nullCD57+CD8+ T (E) The ratio between CCR7+CD8+ T vs. CD45RA+CCR7-CD8+ T (F) Combination of the ratio between CCR7+CD8+ T vs CD28nullCD57+CD8+ T and the ratio between CCR7+CD8+ T vs CD45RA+CCR7-CD8+ T. Abbreviations; LTGS, long-term graft survival; NC, Normal control; TCMR, T cell mediated rejection.

