. 2020 Jun 12;128(6):067010. doi: 10.1289/EHP6508

Figure 3.

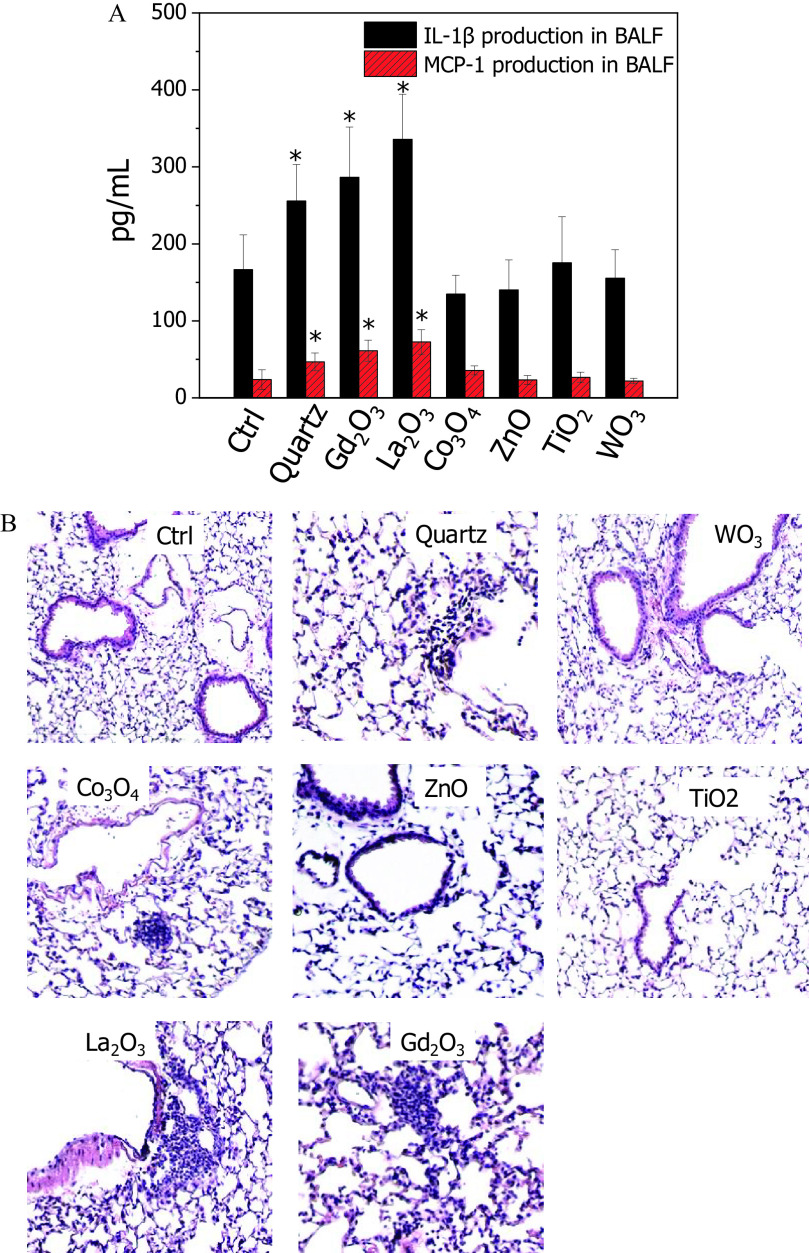
Figure 3 (a) is a clustered bar graph, plotting pictogram per milliliter, ranging from 0 to 500 in increments of 100 (y-axis) across Ctrl, Quartz, Gd subscript 2 O subscript 3, La subscript 2 O subscript 3, Co subscript 3 O subscript 4, ZnO, TiO subscript 2, and WO subscript 3 (x-axis) for IL–1 beta production in BALF and MCP-1 production in BALF. Figure 3 (b) is a schematic of H and E staining of lung tissues after exposed to Ctrl, Quartz, Gd subscript 2 O subscript 3, La subscript 2 O subscript 3, Co subscript 3 O subscript 4, ZnO, TiO subscript 2, and WO subscript 3.

Pulmonary inflammation of six selected metal oxide nanomaterials (MeONPs) in mice. (A) Cytokine production (IL-1β and MCP-1) in BALF, and (B) H&E staining of lung tissues after 40 h exposure to MeONPs. C57Bl/6 mice (n=6) were exposed to La2O3, Gd2O3, Co3O4, ZnO, TiO2, and WO3 at 2mg/kg by oropharyngeal instillation. Quartz was used as positive control to treat animals (5mg/kg). After 40 h, animals were sacrificed to measure IL-1β and MCP-1 production in BALF by ELISA. The lung tissues were fixed for H&E staining (three sections for each mouse). Normal distribution was confirmed by Kolmogorov-Smirnov test (significance>0.05). *p<0.05 compared with vehicle control by two-tailed Student’s t-test.