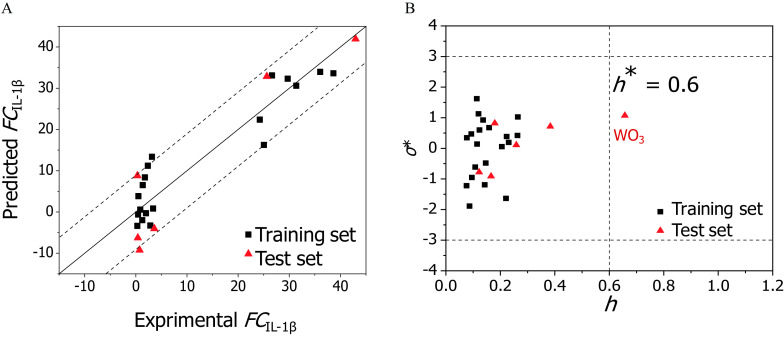
Figure 5.
Performance of the continuous model. (A) Plot of experimentally determined data (x-axis) vs. predicted fold change of production () values (y-axis). The straight solid line represents perfect agreement between experimental and calculated values. Squares represent values predicted for the metal oxides (MeONPs) from the training set; triangles represent MeONPs from the test set. The distance of each symbol from the solid line corresponds to its deviation from the related experimental value. The dotted lines showing the range encompassing 90% of the predictions. (B) Model applicability domain: Williams plot of standardized residuals () vs. leverage values () for . MeONPs having or should be identified as outliers.

