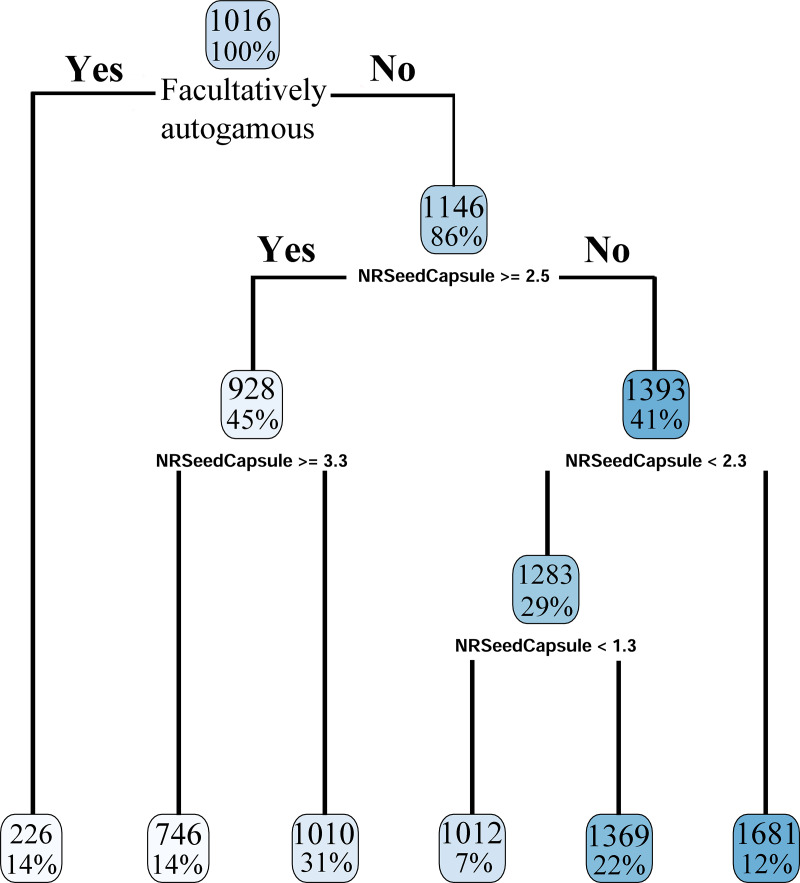
Fig 5. Regression tree analysis of number of seeds per capsule (NRSeedCapsule) and pollen/ovule ratios (P/O) used as an indicator of breeding systems.
The first split separated directly the leaf of 14% facultatively autogamous taxa with an average P/O of 226 (first leaf to the left). At the next node, the remainder species were divided depending on whether they had more or less than 2.5 S/C. 45% of taxa had more than 2.5 S/C and were split again depending whether they had more or less than 3.3 S/C. 14% of taxa had more than 3.3 S/C and were placed in the second terminal leaf, with a P/O of 746. 31% had less than 3.3 S/C and were separated in the third terminal leaf, with a P/O of 1010. Taxa with more than 2.3 S/C were found in the sixth terminal leaf, comprising 12% of the total, P/O of 1681. Taxa with less than 2.3 S/C were divided once more if they have more of less than 1.3 S/C. 7% of the total had less than 1.3 S/C, P/O 1012, while 22% had more than 1.3 S/C and P/O of 1369.

