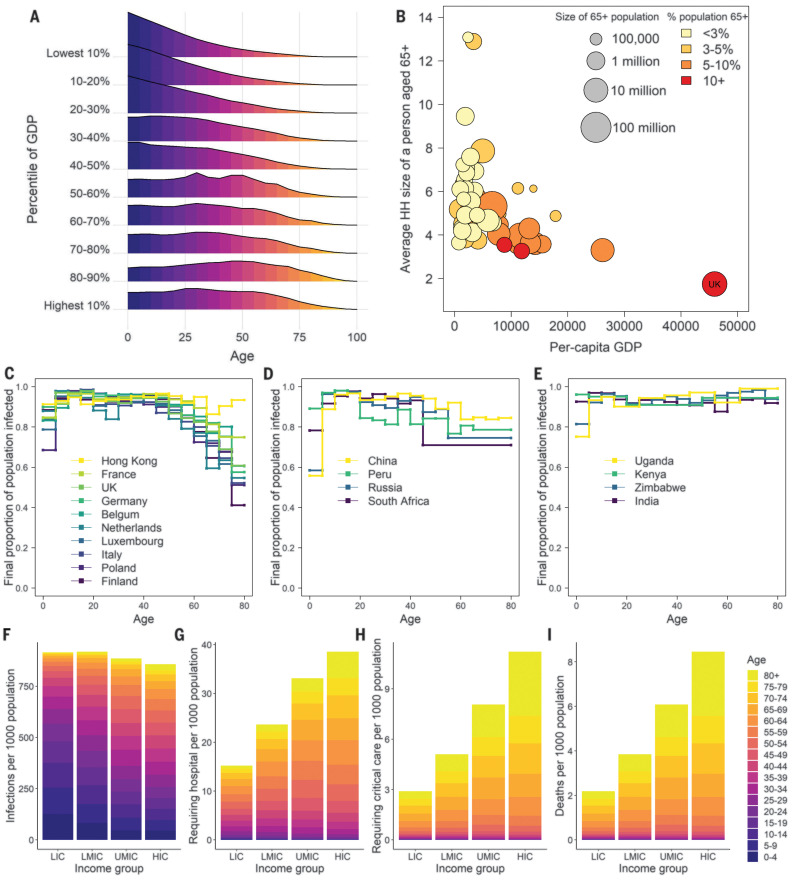
Fig. 1. Demographic, societal, and mixing patterns relevant to SARS-CoV-2 transmission and burden.
(A) Aggregated demographic patterns within 2020 World Population Prospects projections across countries within each 2018 World Bank GDP per-capita decile. (B) Average household (HH) size within Demographic Health Surveys of individuals aged 65 and over by 2018 World Bank GDP per capita. For reference, the average household size of contacts in the UK is also provided as an example for a HIC. (C) Final proportion of population infected in an unmitigated epidemic for an age-structured SIR model with R0 = 3.0 and age-specific social mixing based on contact surveys identified in HICs. (D and E) Equivalent figure for surveys identified in UMICs and LMICs/LICs, respectively. (F to I) Output from simulations across countries of an unmitigated pandemic with R0 = 3.0. (F) Attack rate in terms of number of individuals infected per 1000 population. (G) Equivalent rates of infection leading to illness requiring hospitalization. (H) Illness requiring critical care. (I) Mortality assuming a health system functioning at the level of China throughout the pandemic. LIC, low-income country; LMIC, low- and middle-income country; UMIC, upper–middle-income country HIC, high-income country.

