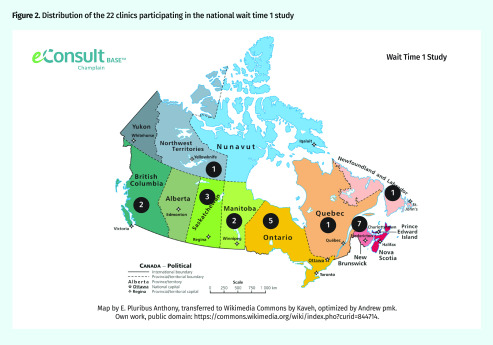
Figure 2.
Distribution of the 22 clinics participating in the national wait time 1 study
Map by E. Pluribus Anthony, transferred to Wikimedia Commons by Kaveh, optimized by Andrew pmk. Own work, public domain: https://commons.wikimedia.org/wiki/index.pho?curid=844714.

