Figure 3.

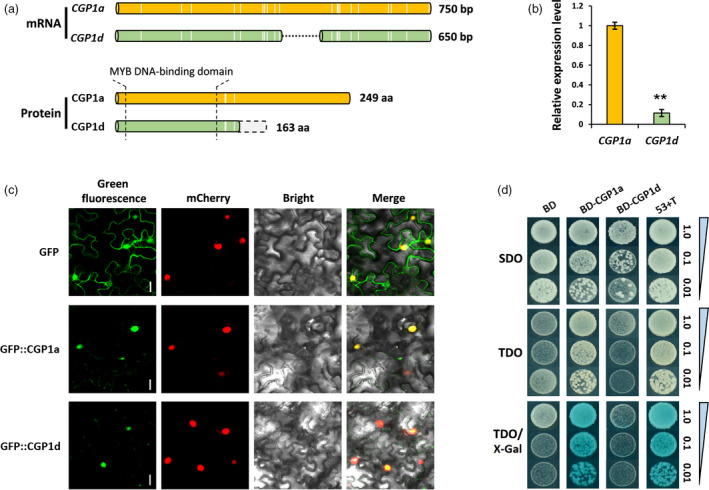
Molecular characterization of CGP1 in upland cotton. (a) Schematic representation of CGP1 mRNA and protein sequences. The white vertical lines indicate SNPs in CGP1a and CGP1d; the dotted black line shows the 100‐bp deletion in CGP1d; the light grey column boxed with dotted line represents the frameshift of CGP1d protein caused by the 100‐bp deletion; the schematic diagram is shown in scale. (b) Relative expression levels of CGP1a and CGP1d in cotton stems (n ≥ 5, ** P < 0.01, t‐test). (c) Subcellular localization of CGP1a and CGP1d in tobacco leaf cells, the red fluorescence of H2B‐mCherry indicates the nucleus, bar = 5 μm. (d) Transcription activity assay of CGP1a and CGP1d using X‐Gal as substrate. SDO (SD/−Trp); TDO (SD/−Ade/−His/−Trp); 53 + T (positive control); BD, empty vector.
