
Figure 4.
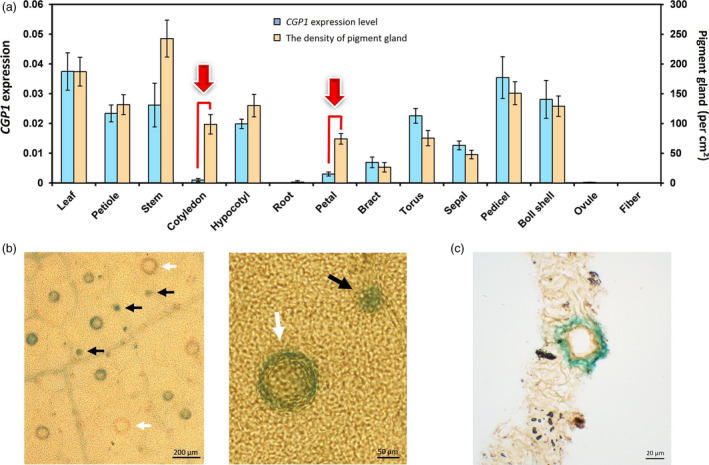
CGP1 expression analysis. (a) qPCR analysis of CGP1 expression (blue columns, left ordinate) and number of pigment glands (orange columns, right ordinate) in several vegetative and reproductive organs (n ≥ 8); (b) GUS staining of ProCGP1‐GUS transgenic cotton leaves. White arrows indicate mature glands, and black arrows indicate glands at an early developmental stage. (c) Section of ProCGP1‐GUS transgenic cotton leaves. Gland structure in leaves turned blue after GUS staining.