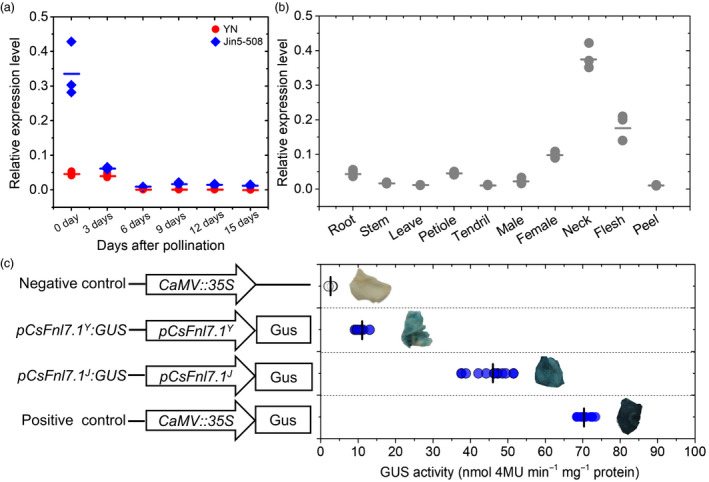
Figure 4.

Expression analyses. (a) Quantitative PCR expression analysis of CsFnl7.1 in necks of Jin5‐508 and YN. (b) Quantitative PCR expression analysis of CsFnl7.1 in different tissues of Jin5‐508. Each circle denotes the mean relative expression level of three replicates. The short lines show the means of three biological replicates. (c) Quantitative and qualitative analyses of the activity of the CsFnl7.1 promoter in tobacco leaves based on GUS histochemical staining. pCsFnl7.1Y : CsFnl7.1 promoter cloned from YN; pCsFnl7.1J : CsFnl7.1 promoter cloned from Jin5‐508. The circles are given as the means of three independent measurements. The short lines show the means of ten biological replicates.
