Figure 5.

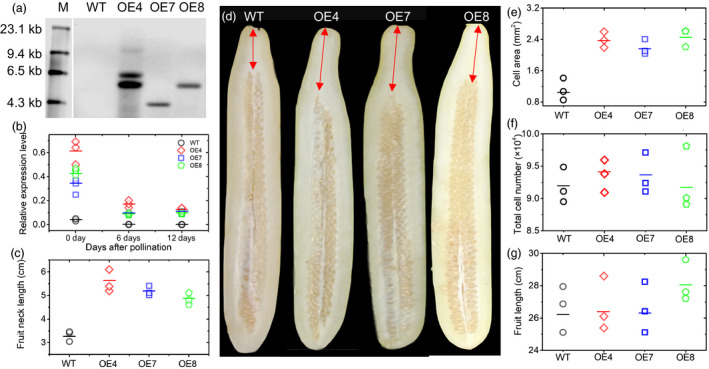
Cucumber transgenic analysis. (a) Southern hybridization results of wild type (WT) and T2 transgenic overexpression lines OE4, OE7 and OE8. The gDNA was digested with KpnI and hybridized with a digoxigenin‐labelled NPT II probe. M indicates the marker. (b) Confirmation of CsFnl7.1 expression levels in the WT and transgenic cucumber lines as assessed by quantitative PCR. Each value denotes the mean relative expression level of three replicates. (c) Comparison of average fruit neck lengths of WT and transgenic lines at 40 days after self‐pollination. Each value denotes the mean of 3–10 fruits. (d) Phenotypes of WT and three independent transgenic cucumber lines (OE4, OE7 and OE8) at 40 days after self‐pollination. (e) The average cell areas (n = 100) in the necks of WT and transgenic lines harvested at 40 days after self‐pollination. Each value denotes the mean relative expression level of three replicates. (f) Comparison of total cell numbers of WT and transgenic lines at 40 days after self‐pollination. Each value denotes the mean of 10–15 non‐overlapping fields of view. (g) Comparison of average fruit lengths of WT and transgenic lines at 40 days after self‐pollination. Each value denotes the mean of 3–10 fruits. The short lines show the means of three biological replicates.
