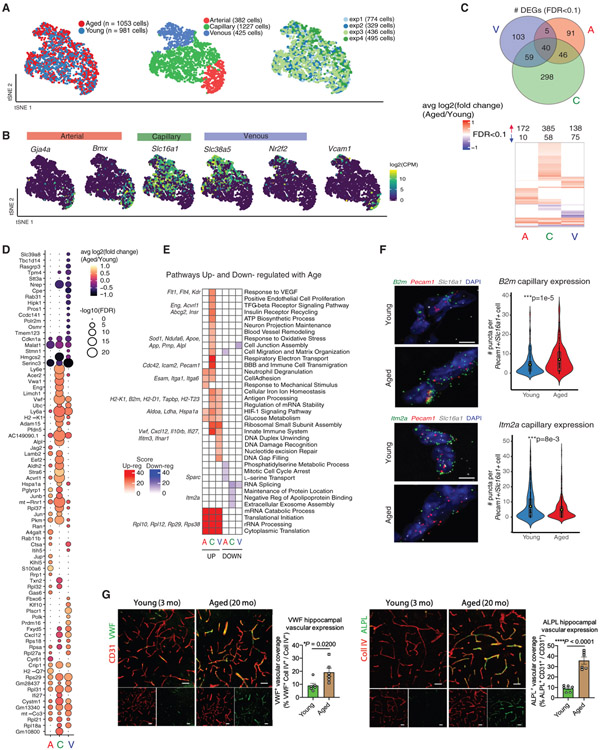
Figure 3. Normal Aging Induces Transcriptomic Changes Specific to Each Segment Identity.
(A) t-Distributed stochastic neighbor embedding (tSNE) of normally aged and young BECs after canonical correlation analysis (CCA), using the top-9 correlation components. Aged and young cells show comparable distributions of A, C, and V identities along the A-C-V axis. Note that segmental identity largely drives cluster formation, rather than age.
(B) Distribution of key A-C-V segment identity markers in tSNE-space.
(C) Venn diagram showing the numbers of DEGs (FDR < 0.1) shared between different vessel segments. Heatmap of the union of all DEGs up- and downregulated in aged A, C, or V cells, illustrating the degree of overlap of DEGs between each segment.
(D) Dotted heatmap of the top 80 DEGs ranked by the signed-FDR value (product of log2FC*−log10(FDR)). Color indicates the average log2FCof aged/young, while the dot size represents degree of statistical significance. DEGs with FDR < 0.1 for at least one vessel segment are listed and ordered by hierarchically clustering (dot size = 0 indicates FDR > 0.1).
(E) GO analysis of DEGs (FDR < 0.1) up- and downregulated in aged A, C, and V cells. Left-hand side (red) indicates pathways over-represented in DEGs upregulated with aging, right-hand side (blue) likewise in DEGs downregulated with aging. Exemplary genes contributing to pathway enrichments are listed on the side.
(F) Representative images and quantification of B2m and Itm2a expression in young and aged hippocampal capillaries (Slc16a1+Pecam1+) following RNA in situ hybridization (B2m: n = 205 cells (young), 295 cells (aged); Itm2a: n = 429 cells (young), 356 cells (aged), two-sided t test; mean ± SEM). Scale bar, 5 μm.
(G) Representative images and quantification of VWF and ALPL expression (green) in CD31+ or collagen IV+ vasculature (red) in the hippocampus of young (3 months) and aged (20 months) mice (n = 6, two-sided t test; mean ± SEM). Scale bar, 40 μm.

