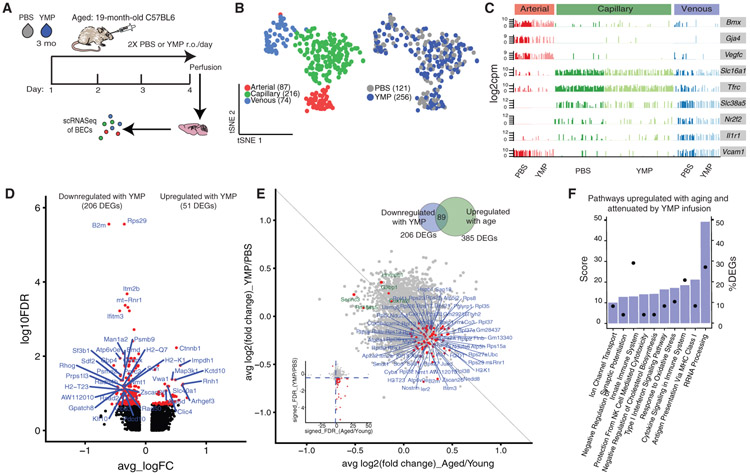
Figure 5. Young Plasma Exposure Partially Reverses the Transcriptomic Signature of Normal Brain Capillary Aging.
(A) Schematic of the young mouse plasma (YMP) acute infusion paradigm in aged mice.
(B) tSNE of YMP-treated and PBS-treated BECs from aged (20 months) mice after CCA, using the top-9 correlation components. AMP- and PBS-treated cells show comparable distributions of A, C, and V identities, suggesting plasma infusions do not significantly alter native segmental identities.
(C) Expression bar plots of canonical A-C-V marker genes in YMP- and PBS-treated BECs, with segmental identities defined by unbiased clustering in (B).
(D) Volcano plot depicting up- and downregulated genes with YMP treatment in capillaries (compared to PBS control). Genes marked in red are significant (FDR < 0.1). FDR values are calculated only with genes showing an average log2FC > 0.1. Genes labeled red are FDR < 0.1.
(E) Scatterplot of genes and their log2FCin both aged/young and YMP/PBS treatment in capillaries. The 89 genes that are upregulated with age (aged/young) but decreased with YMP (YMP/PBS)—and vice-versa (FDR < 0.1 in aging and FDR < 0.1 in YMP)—are labeled. These age-upregulated DEGs are likely modulated and/or reversed via exposure to YMP. Inset shows the same genes (red) on a scatterplot of the signed-FDR value (product of log2FC*−log10(FDR)) for normal aging and YMP.
(F) Top pathways over-represented by DEGs upregulated in normal aging and downregulated with YMP treatment (89 intersecting DEGs).

