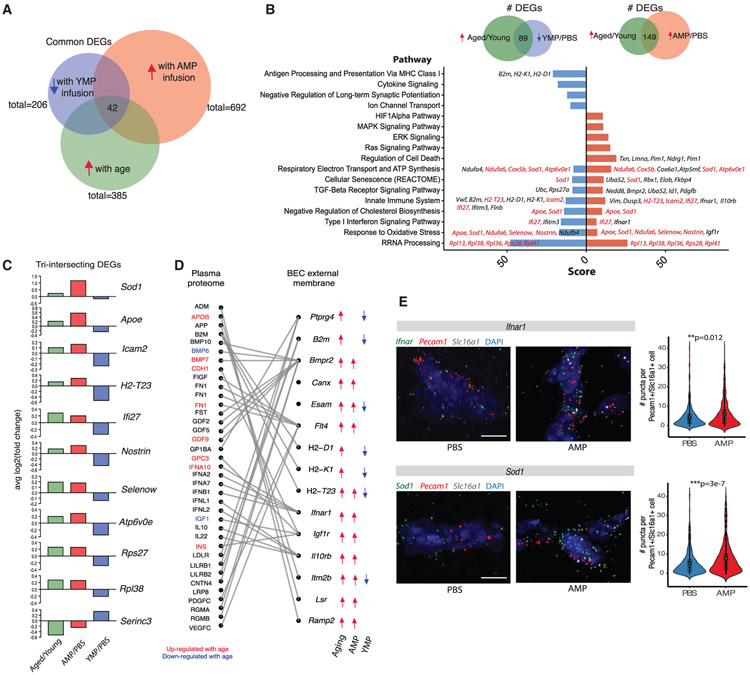
Figure 6. The Circulatory Environment Induces Cell Non-autonomous Brain Endothelial Aging.
(A) Venn diagram depicting the number of DEGs shared between each treatment condition (aged/young, AMP/PBS, and YMP/PBS). 42 genes are differentially expressed in all three treatment groups (i.e., increasing with normal aging and AMP but decreasing with YMP).
(B) Bar plot of top biological pathways over-represented in DEGs shared between aging and AMP (149 DEGs) or shared between aging and YMP (89 DEGs). Score is derived from GeneAnalytics software. The presence of common pathways suggests YMP may reverse some transcriptional consequences of AMP treatment and normal aging. Select genes in each pathway are listed, with DEGs shared across all three treatments labeled in red.
(C) Bar plot of the log2FC of top DEGs that intersect in all three treatments (aged/young, AMP/PBS, and YMP/PBS). These genes are likely modulated by plasma factors upregulated in a normal aged milieu, with expression changes reversible via exposure to young plasma.
(D) Sankey plot depicting relationships between DEGs encoding BEC surface receptor or membrane proteins, and their corresponding plasma ligands. Directionality of expression changes in each condition (normal aging, AMP, and YMP) are denoted with arrows. Corresponding ligands found significantly up- (red) or downregulated (blue) with age in mouse plasma (SOMALogic) are highlighted.
(E) Representative images and quantification of Sod1 and Ifnar1 expression in AMP-exposed hippocampal capillaries (Slc16a1+Pecam1+) following RNA in situ hybridization (Sod1: n = 595 cells [PBS], 576 cells [AMP]; Ifnar1: n = 746 cells [PBS], 916 cells [AMP]; two-sided t test; mean ± SEM). Scale bar, 5 μm.

