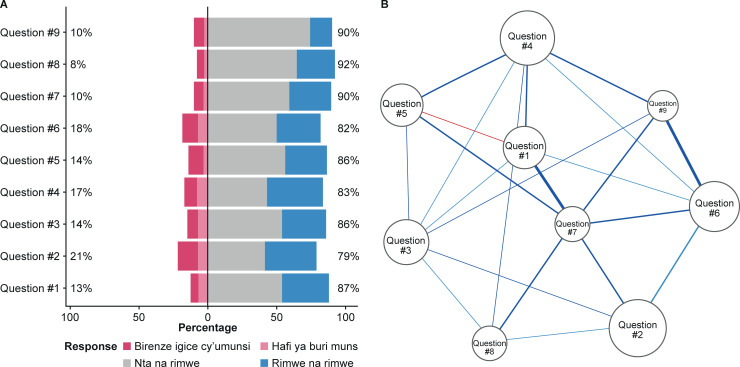
Fig 1.
Likert responses distribution (A) and correlation pattern between items (B) of the Rwandan version of the PHQ-9. The size of the nodes (circles) represents the average response in the Likert scale for each item. The thickness of the lines (edges) represents the partial correlation between items. Nta na rimwe = not at all, never; Rimwe na rimwe = several days, sometimes; Birenze igice cy’umunsi = more than half the days; Hafi ya buri munsi = nearly every day.

