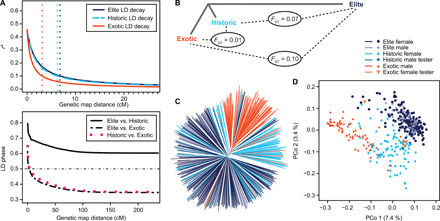
Fig. 1. Genetic diversity is maximized in the hybrid wheat parents.

The 217 parents of the Elite set, 98 Historic parents, and 69 Exotic parents were analyzed for linkage disequilibrium (LD) and population structure parameters. (A) Decay of LD (r2) with genetic map distance in the three sets and persistence of the LD phase based on pairwise correlations of LD phase between the three sets. Vertical dotted lines show the decay of LD below 0.1. (B) Neighbor-joining tree based on the results of FST statistics for the three sets. (C) Neighbor-joining tree based on modified Rogers’ distances. (D) Principal coordinate analysis based on modified Rogers’ distances. Percentages in parentheses refer to the proportion of genotypic variance explained by the first and second principal coordinates.
