
Fig. 1. Annual-mean trend and two leading modes of Antarctic surface temperature during 1958 to 2012.
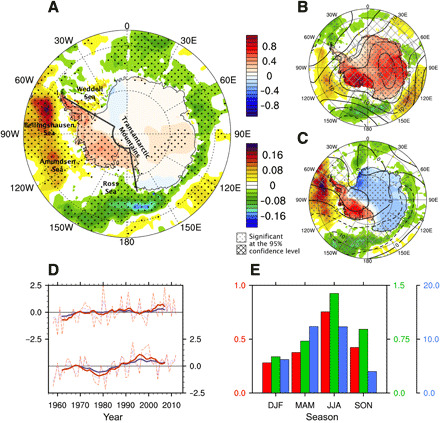
(A) Trends in the SAT (in K decade-1) and SST (in K decade-1) and (B and C) the two leading EOFs of the annual-mean SAT during 1958 to 2012 and its regressed SAT (in K, shading over Antarctica), 300-hPa geopotential height (in meters, contour), and SST (in K, shading over the ocean). The dark gray line in (A) indicates the dividing boundary for East and West Antarctica. (D) Year-to-year variations in the average over all of Antarctica (in K, red line), the corresponding PC of EOF1 (unitless, blue line) (top), the difference between West and East Antarctica (in K, red line), and the corresponding PC of EOF2 (unitless, blue line) (bottom). The thick lines indicate 10-year running means. (E) Seasonal characteristics of the second EOF PC: correlation coefficients with the second EOF PC of seasonal mean SAT (unitless, red bar), the difference between West and East Antarctica in regressed seasonal mean SAT (in K, green bar), and area-averaged heights over the 60°S to 85°S, 150°W to 50°W in regressed seasonal mean 300-hPa geopotential height (in meters, blue bar).