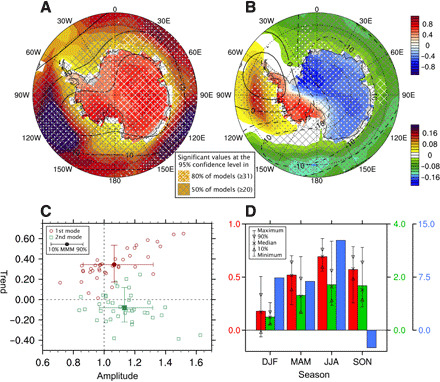
Fig. 2. Two leading modes of the annual-mean Antarctic surface temperature and their characteristics during 1958 to 2012 in the CMIP5 historical simulations.

(A and B) Multimodel mean (MMM) regression pattern of annual-mean SAT (in K), SST (in K), and 300-hPa geopotential height (in meters) in the 38 CMIP5 models for the (A) first and (B) second EOF modes of NB2014 by CBF analysis. (C) Scatterplot of the amplitudes and trends (in K decade-1) of the PC time series from the CMIP5 models normalized by the SD of the NB2014. The amplitudes are defined by the ratio of the CMIP5 model to the NB2014. (D) MMM characteristics of the second EOF mode of Antarctic SAT during each season: correlation coefficients of the second EOF PC of seasonal mean SAT with annual-mean SAT (unitless, red bar), the difference between West and East Antarctica in regressed seasonal mean SAT (in K, green bar), and area-averaged heights over the 60°S to 85°S, 150°W to 50°W in regressed seasonal mean 300-hPa geopotential height (in meters, blue bar). Whisker lines for the blue bar are not shown according to their large range.
