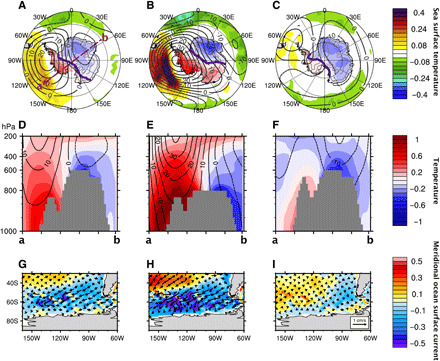
Fig. 5. West-East Antarctic asymmetric modes according to the Antarctic terrain.

Regressions of the annual-mean surface temperature onto the EOF mode representing the east-west Antarctic asymmetry from coupled atmosphere-ocean model experiments with three different Antarctic terrains: (A, D, and G) current Antarctic terrain, (B, E, and H) East Antarctic terrain lowered to 1500 m, and (C, F, and I) West Antarctic terrain elevated with a factor of 2. The explained variances in these asymmetric modes are 19.6, 33.0, and 20.7%, respectively. Shading over the Antarctic continent, shading over the ocean, and the black contour lines in the top panels indicate the regression patterns of the annual-mean SAT (in K), SST (in K), and 300-hPa geopotential height (in meters), respectively. The thick gray contour line over the Antarctic continent indicates the elevation of the terrain. Shading and contour lines in the middle panels indicate the regressions of air temperature (in K) and geopotential height (in meters) for each asymmetry mode along the great circle line from 160°W 60°S (a) to 55°E 60°S (b) [the dashed purple line on (A)], respectively. Vector and shading over the ocean in the bottom panels indicate the regressions of ocean surface current and its meridional component for each asymmetry mode, respectively.
