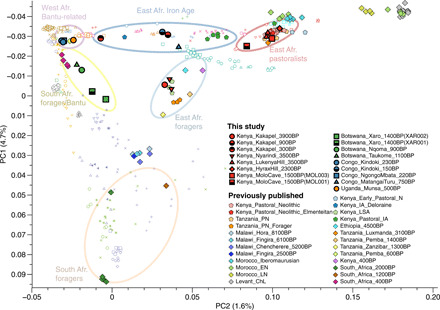
Fig. 2. PCA of ancient genomic data analyzed in this and previous studies, together with published modern genetic data.

Modern populations shown are detailed in the legend of Fig. 1 and fig. S1. A separate PCA with only present-day populations is shown in fig. S1A. Color circles highlight the key groups discussed in this paper and summarized in Fig. 3A.
