. 2020 Jun 1;9:e55096. doi: 10.7554/eLife.55096

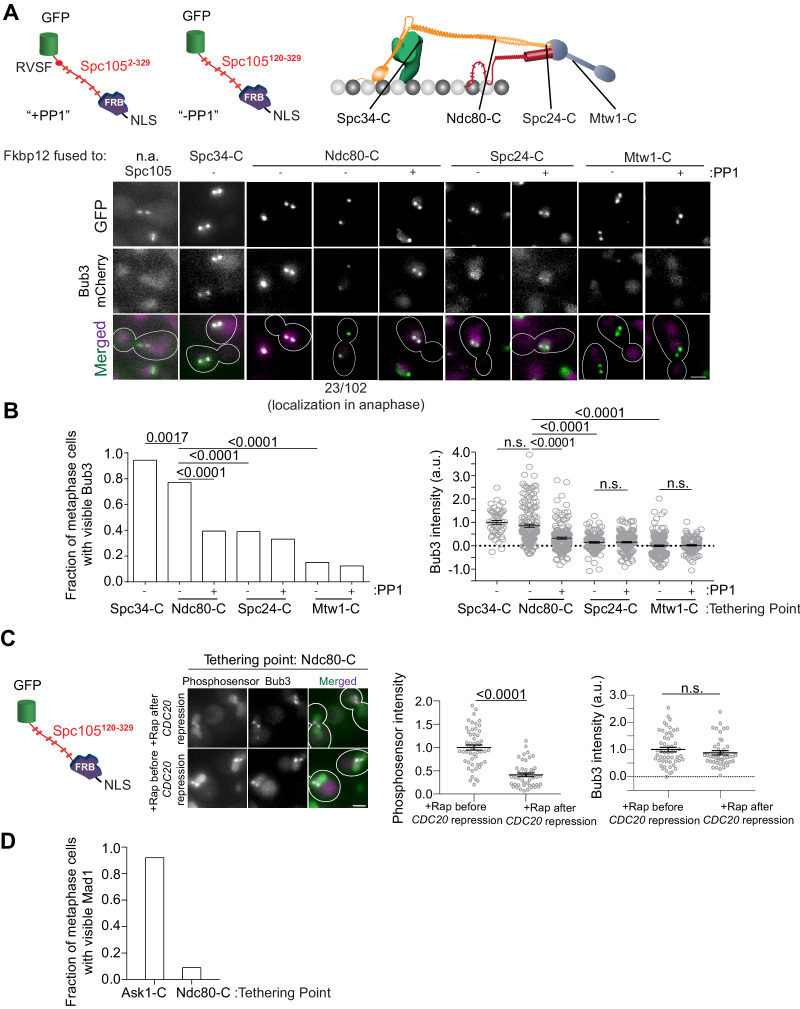
Figure 3. A gradient of Mps1 kinase activity continues to phosphorylate MELT motifs after chromosome biorientation.

(A) Top left: Cartoons show schematics of the two Spc105 phosphodomains tethered to kinetochore subunits using the rapamycin-induced dimerization of Fkbp12 and Frb domains. Top right: The kinetochore subunits (Spc34-C, Ndc80-C, Spc24-C and Mtw1-C) at which, the phosphodomains were tethered by rapamycin induced dimerization. Bottom: Micrographs show representative images of cycling cells wherein the phosphodomain is tethered to the C-terminus of the indicated kinetochore subunit. (n.a. - Not Applicable). (B) Left: The bar plot shows the scoring of cells with bioriented kinetochore clusters based on whether or not they visibly recruit Bub3-mCherry. (n = 71 for Spc34-C, 109 and 94 for Ndc80-C, 95 and 103 for Spc24-C, 106 and 122 for Mtw1-C, accumulated from two experimental and biological repeats (whenever possible). Right: The scatter plot on the right shows the quantification of Bub3-mCherry fluorescence from all cells with bioriented kinetochore clusters. (mean+ s.e.m. n = 47 for Spc34-C, 159 and 153 for Ndc80-C, 114 and 154 for Spc24-C, 173 and 104 for Mtw1-C, accumulated from two experimental and biological repeats wherever possible). n.s. Not significant. (C) Micrographs show the recruitment of Bub3-mCherry by the phosphosensor tethered at the Ndc80 C-terminus in cycling (before CDC20 repression) and metaphase arrested cells (after CDC20 repression). Scatterplots show the relative fluorescence signal from the GFP-tagged phosphosensor and Bub3-mCherry respectively. (mean+ s.e.m. n = 52 and 45 for rapamycin treated samples before and after Cdc20 depletion from two technical replicates). n.s. Not significant. (D) Bar graph shows fraction of cells visibly recruiting Mad1-mCherry as shown in the micrographs (n = 242 and 142 for Ask1-C and Ndc80-C respectively).

Figure 3—source data 1. Data that are included in the plots of Figure 3B left and right, 3C left and right and 3D are shown here.
Individual pages were created in this excel file for each subfigure.

Figure 3.

Figure 3—figure supplement 1. The distribution of the Spc105 phosphodomain in bioriented kinetochores and the position-dependent effects of tethering an additional phosphodomain within the kinetochore.

Figure 3—figure supplement 1.

(A) The assessment of the nanoscale distribution of the unstructured phosphodomain of Spc105 using FRET. Top: Schematic displays the GFP-insertion positions within Spc105. Middle: Positions of the mCherry tagged kinetochore subunits (Dad4-C and Spc25-C) that demarcate the region that was expected to be occupied by the Spc105 phosphodomain. Bottom: Scatter plots show the proximity ratio (which is proportional to FRET) of donor GFP fused at the indicated residue in Spc105 with Spc25 C-terminus (left) and Dad4 C-terminus (right). (mean+ s.e.m. n = 74, 165, 142, 177 and 103 respectively for FRET involving Spc25-mCherry, accumulated from at least three repeats. n = 114, 134 and 224 for N, 222 and 455 respectively from three repeats for FRET involving Dad4-mCherry, accumulated from at least two repeats). n.s. Not significant. (B) Flow cytometry-based quantification of the DNA content in cells treated with rapamycin (prior to sample collection at 0 min) to tether the Spc105 phosphodomain anchored to Ask1-2xFkpb12 (which is proximal to the CH-domains) or Ndc80-2xFkbp12 (which is distal from the CH-domains) (schematic shown at the top). Bottom: Representative histogram from two trials for each strain is shown. (C) Quantification of amount of Spc105 phosphodomain tethered to bioriented kinetochore clusters (mean+ s.e.m. n = 74 and 80 for Ndc80-C, 78 and 76 for Spc24-C, 102 and 173 for Mtw1-C, pooled from at least two experimental replicates). (D) (Supports in Figure 4C) Quantification of population growth for the indicated strains in benomyl-containing media (30 µg/ml) (mean ± s.e.m., n = at least 3).
Figure 3—figure supplement 1—source data 1. Data required to prepare the plots included in Figure 3—figure supplement 1A bottom left and right, C and D.
Individual pages were created in this file for each subfigure.