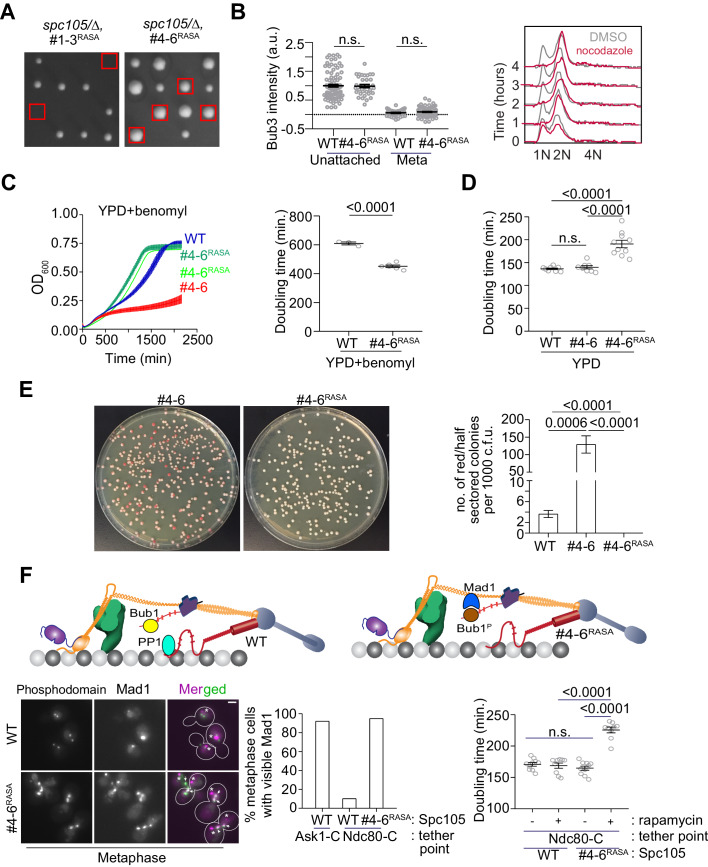
Figure 6. Designing an Spc105 variant optimized for SAC signaling, error correction, and SAC silencing.
(A) Left: Tetrad dissections showing the rescue of Spc105RASA by inactivating the first three MELT repeats. Right: Scatter plot depicting Bub3 intensities in unattached and bioriented kinetochores of indicated strains (mean+ s.e.m. n = 92 and 37 for WT, 33 and 98 for #4-6RASA, pooled from two technical repeats). n.s. Not significant. (B) Representative flow cytometry-based quantification of the DNA content of the indicated strains during a prolonged exposure to nocodazole (n = 2). (C) Quantification of the doubling times of the indicated strain in YPD respectively (horizontal line marks the mean value, minimum number of experimental repeats n = 2).( D) Left: Quantification of population growth for the indicated strains in presence of benomyl (30 µg/ml) (mean ± s.e.m., n = 3). Right: Quantification of the doubling times of the indicated strain in YPD+benomyl (30 µg/ml) respectively (horizontal line marks the mean value, minimum number of experimental repeats n = 2). (E) Estimation of chromosome loss by colony sectoring assay. Left: Plate images of #4–6 and #4-6RASA strains grown in YPD plates. Right: Bar graph displays the number of red or half sectored colonies per 1000 colony forming units. N = 5081, 4965 and 6596 for WT, #4–6 and #4-6RASA respectively, pooled from ≥6 technical repeats. (F) Top: Model explaining why Spc105 phosphodomain tethered in the inner kinetochore does not activate the SAC. Bottom left: Representative micrographs display Mad1-mCherry localization relative to bioriented kinetochores in the indicated strains after treatment with rapamycin. The Mad1-mCherry puncta marked with an asterisk result from the deletion of the nuclear pore protein Nup60. These puncta are not associated with kinetochores. The ones co-localized with kinetochores are marked with arrowheads. Scale bar ~3.2 µM. Bottom middle: Bar graph of the percentage of cells visibly recruiting Mad1-mCherry (n = 242, 142 and 290 for Ask1-C, Ndc80-C and Ndc80-C, #4-6RASA respectively, derived from two technical repeats). Bottom right: Scatter plot presents the doubling time of the indicated strains. mean+ s.e.m from ≥three experimental repeats. n.s. Not significant.

