
Figure 2. Structure of the EMC2•EMC9 complex.
(A) Crystal structure of the EMC2•EMC9 heterodimer (PDB: 6Y4L). The heterodimer consists of EMC2 (residues 11–274), depicted in blue, and EMC9 (residues 1–200), depicted in orange. The TPR-repeat motif of EMC2 is indicated. (B) Physicochemical properties of a vestibule in the EMC2•EMC9 complex. Surface rendering of crystal structures coloured according to chemical properties (Hagemans et al., 2015).

Figure 2—figure supplement 1. Protein structure prediction confirms structural homology between EMC9 and EMC8.

(A) Reference free ab initio modelling of EMC8 (blue) using Robetta results in a model with an overall RMSD of 2.3 Å when aligned to the EMC9 crystal structure (grey). The majority of this disparity is the result of a single misaligned helix and the location of an 11 residue insertion in a loop in EMC8. Docking of the predicted structure into the EMC2•EMC9 structure in the place of EMC9 results in a good fit with no steric violations. (B) Ab initio modelling of EMC8 (yellow) using Robetta with the EMC9 crystal structure (grey) as a template results in an improved model with an overall RMSD of 0.6 Å. As with the reference-free model, the template-based model of EMC8 yields the same core fold and fits well when substituted into the EMC2•EMC9 crystal structure.
Figure 2—figure supplement 2. EMC8 and EMC9 have similar affinities for EMC2.
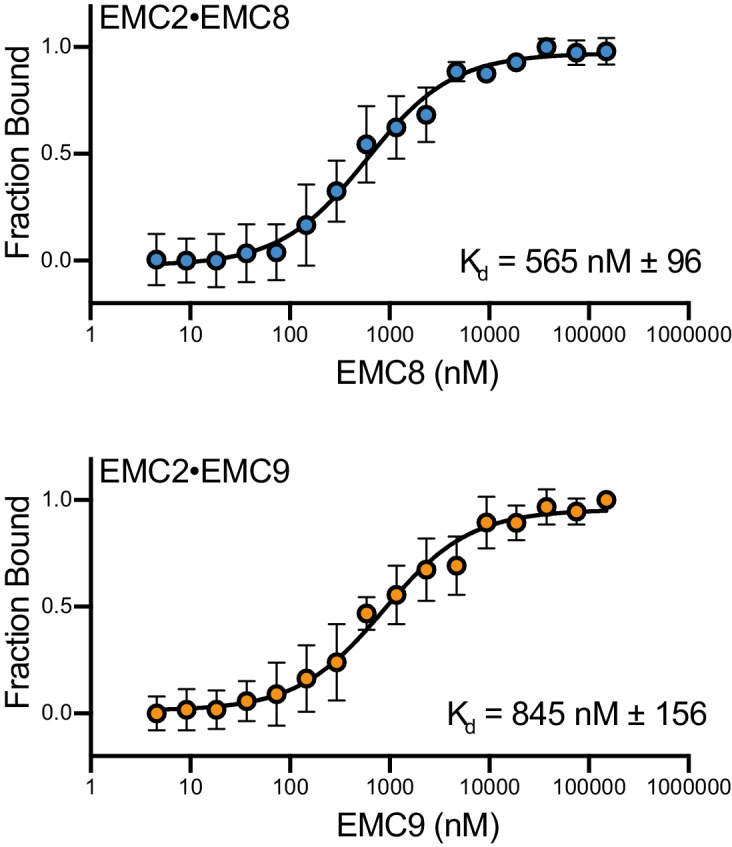
Microscale thermophoresis was used to determine affinities of the heterodimer. An endogenous solvent accessible cysteine in EMC2 was labeled with maleimide-OG488 and held at a fixed concentration of 50 nM. Either EMC8 or EMC9 were titrated from 4 nM - 150 µM. Affinities calculated for EMC2•EMC8 (blue) and EMC2•EMC9 (orange) were ~550 nM and ~850 nM respectively. Thermophoresis data were fit using NanoTemper’s in software quadratic model, and equivalent results were attained using nonlinear fit model in Prism GraphPad. Data consist of two biological replicates with two technical replicates each. Data points represent the mean and error bars represent standard deviation.