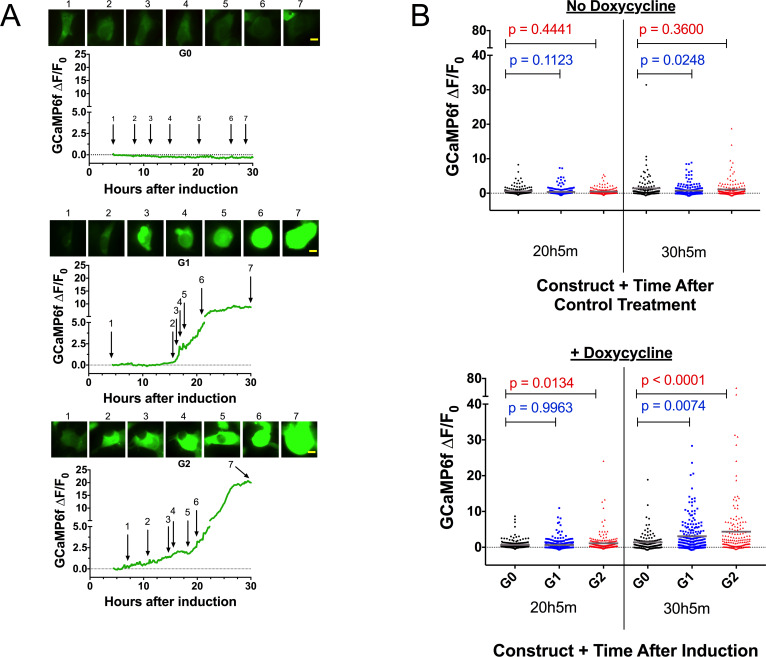
Figure 3. Expression of the RRVs leads to a Ca2+ influx that precedes cell swelling and death.
(a) Fluorescence traces of representative GCaMP6f-positive cells demonstrating that G1 and G2 cause a Ca2+ influx prior to cell swelling. GCaMP6f-transfected FT293 cells were incubated with DRAQ7 followed by 50 ng/mL doxycycline to induce APOL1 expression and then imaged via widefield every 10 min for 4.5–30 hr post induction. Traces represent levels of cytoplasmic Ca2+ over time as measured by GCaMP6f fluorescence (no DRAQ7 was observed in depicted cells). Cells are from Video 1. Scale bars = 20 μm. (b) High-throughput analysis revealed a significant increase of cytoplasmic Ca2+ levels driven by G1 and G2 compared to G0. Each point is the ∆F/F0 for an individually tracked cell and bars represent the cell population mean of GCaMP6f fluorescence. Cells were analyzed from 4 fields of view per condition, n = 1748. A one-way ANOVA multiple comparisons test was performed to compare the RRVs with G0 at the indicated timepoints.

