. 2020 May 19;9:e51185. doi: 10.7554/eLife.51185

Figure 4. Ca2+ influx and cytotoxicity of G1 and G2 requires trafficking from the ER.

(a) Schematic of the RUSH system. Streptavidin was expressed with a signal peptide and KDEL allowing for localization and retention in the ER lumen along with streptavidin-binding protein (SBP) tagged APOL1. SBP binds to streptavidin causing APOL1 to be retained in the ER until synchronous release is initiated by the addition of biotin. (b) Time course showing that RRV cytotoxicity requires trafficking from the ER. 24 hr after transfection, HEK293 cells were treated with or without (0 hr) 80 µM biotin at the indicated times. 48 hr post-transfection, cytotoxicity was measured via release of lactate dehydrogenase. To compare cytotoxicity between biotin treated and untreated (0 hr) for respective genotypes, a two-way ANOVA with multiple comparisons was performed (n = 6). (c) Fluorescence traces of GCaMP6f-positive HEK293 cells showing that the G1 and G2-mediated Ca2+ influx occurs after trafficking from the ER. GCaMP6f-transfected cells were incubated with DRAQ7 followed by 80 µM biotin to release APOL1 and were then imaged via widefield every 5 min for 1–18 hr post treatment. Cells are from Video 2. Scale bars = 20 μm. (d) High-throughput imaging and analysis was performed as in Figure 3b, demonstrating that the G1 and G2-mediated Ca2+ influx requires trafficking from the ER. Each point is the ∆F/F0 for an individually tracked cell and bars represent the cell population mean of GCaMP6f fluorescence. Cells were analyzed from 3 fields of view per condition, n = 1657. A one-way ANOVA multiple comparisons test was performed to compare the RRVs with G0 at the indicated timepoints.

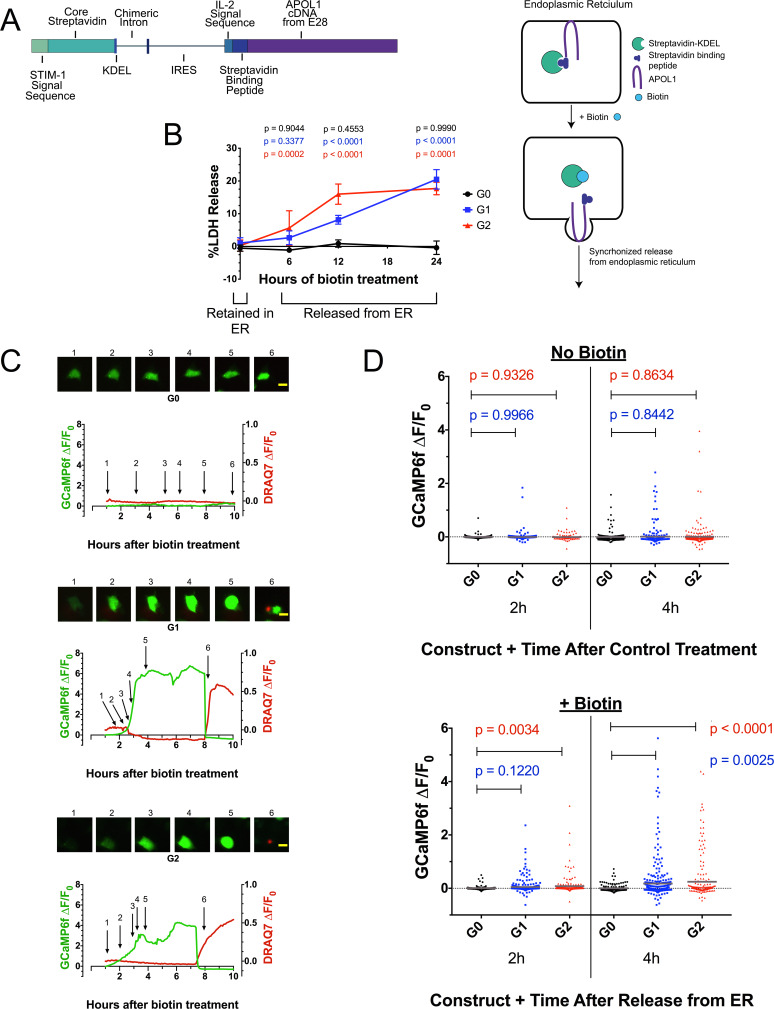
Figure 4.

Figure 4—figure supplement 1. Validation of protein expression and Ca2+-driven cytotoxicity of APOL1 in the RUSH system.

Figure 4—figure supplement 1.

(a) Western blot of whole cell lysates displaying protein expression of RUSH-APOL1 in HEK293 cells 24 hr after transfection. Cells were not treated with biotin. (b) Fluorescent traces of all GCaMP6f-positive HEK293 cells in Video 2 and Figure 4d (c) High throughput microscopy and analysis was performed as in Figures 3b and 4d, validating in CHO cells the requirement of G1 and G2 trafficking from the ER to mediate a Ca2+ influx and cell swelling. RUSH-APOL1 transfected CHO cells were treated with or without 80 µM biotin and imaged via widefield every 5 min for 1–12 hr post treatment. Each point is the ∆F/F0 for an individually tracked cell and bars represent the cell population mean of GCaMP6f fluorescence. Representative cells from this analysis can be viewed in Video 3. Cells were analyzed from 3 different fields of view per condition, n = 882. A one-way ANOVA multiple comparisons test was performed to compare G1 and G2 with G0 at the indicated timepoints. (d) Fluorescent traces of all GCaMP6f-positive CHO cells from Video 3. (e) All cells from 4 hr after +/- biotin treatment in Figure 4d were directly compared via one-way ANOVA.
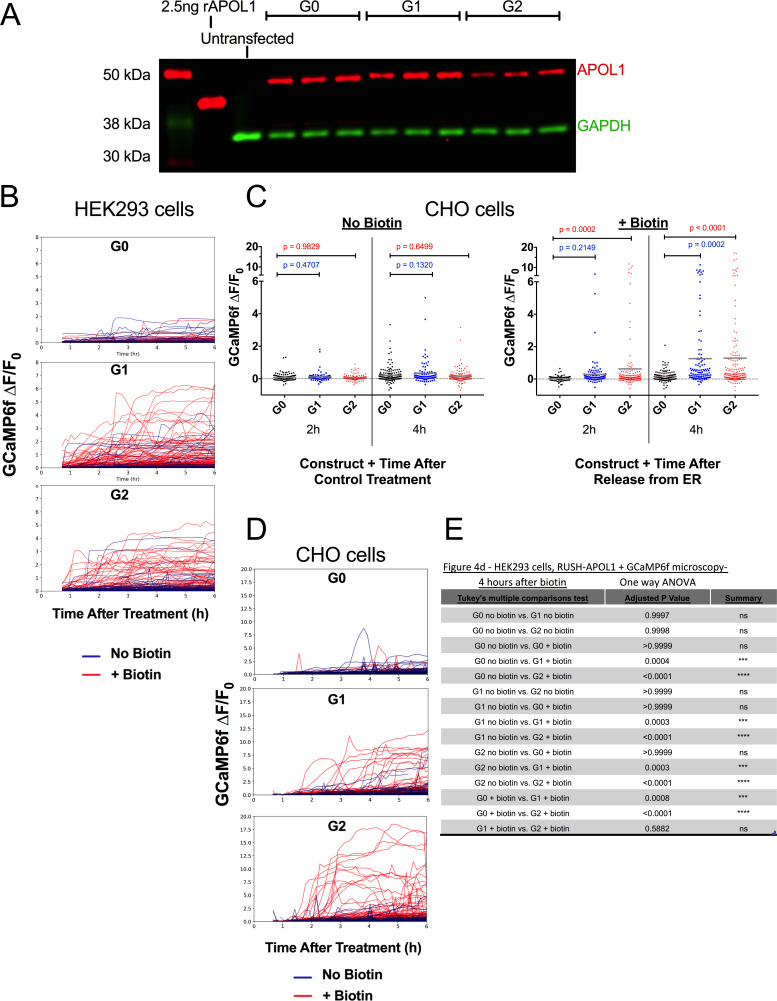
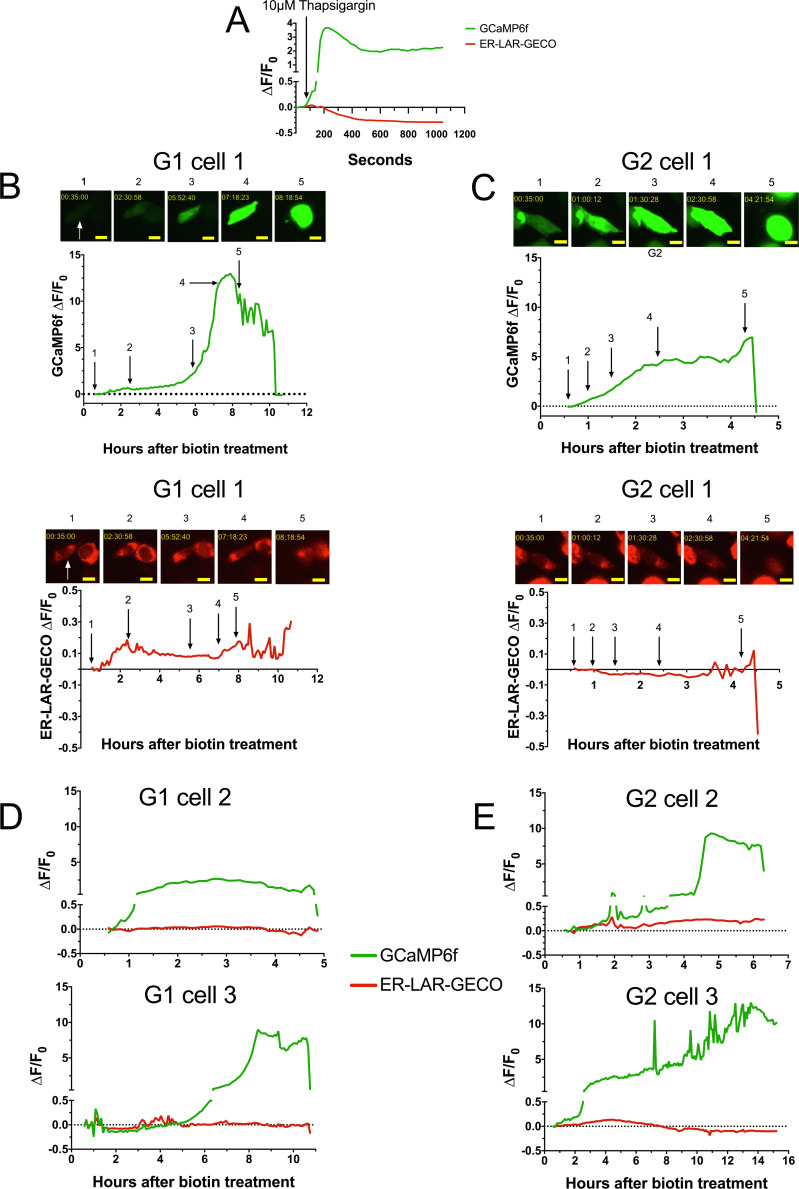
Figure 4—figure supplement 2. The G1 and G2-mediated cytoplasmic Ca2+ influx is not due to ER Ca2+ release.

Figure 4—figure supplement 2.

(a) Validation for the simultaneous use of Ca2+ sensors GCaMP6f and ER-LAR-GECO from a representative cell. Co-transfected cells were treated with 10 µM thapsigargin to prevent Ca2+ reuptake in the ER, which increases cytoplasmic Ca2+ levels (GCaMP6f) while concurrently depleting ER Ca2+ (ER-LAR-GECO). Cells were imaged via widefield. (b–e) Fluorescence traces revealing that there is no ER Ca2+ release during G1 and G2 mediated cytotoxicity. CHO cells were co-transfected with RUSH-APOL1, GCaMP6f, and ER-LAR-GECO, then treated with 80 µM biotin and imaged via widefield every 5 min for 0.5–12 hr post treatment. Cells that displayed the established phenotype of Ca2+ influx followed by cell swelling were selected for analysis. Representative cells are from Video 4. A minimum of 5 cells were analyzed per genotype. Scale bars = 10 µm.