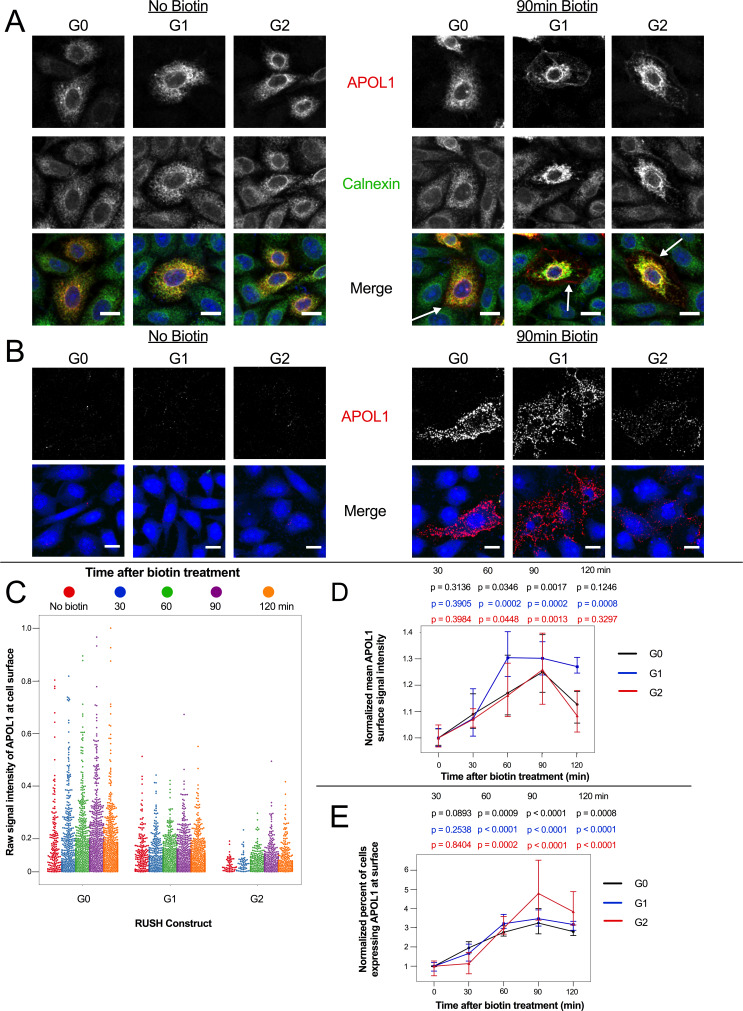
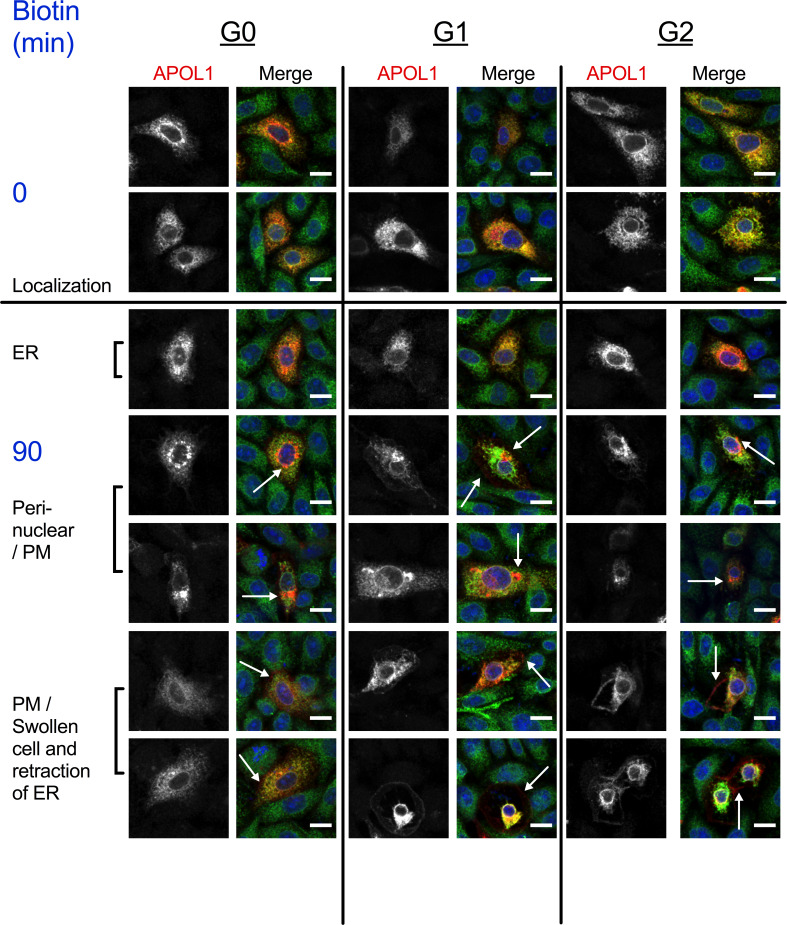
Figure 5. APOL1 traffics to the PM prior to Ca2+ influx.
(a) Confocal images of transfected and permeabilized CHO cells depict RUSH-APOL1 (red) localized to the ER (stained via calnexin, green) without biotin followed by partial PM localization after 90 min of biotin treatment. Representative cells from n = 3 independent experiments. (b) RUSH-APOL1 localizes to and forms punctae at the PM within 90 min of biotin treatment. CHO cells were treated and imaged as in (a) except without permeabilization. Here anti-calnexin (green) was used as a control for cell permeabilization (depicted in the merged images, no permeabilization was detected). Representative cells from n = 4 independent experiments. (c) High-throughput confocal microscopy reveals that RUSH-APOL1 begins localizing to the PM within 60–90 min. Cells were randomly imaged at 20x, capturing ≥10 fields of view per well from 3 replicate wells for each condition. Calnexin signal was used to filter out permeabilized cells. Each dot represents a single cell (n = 462,918 cells analyzed). (d–e) RUSH-APOL1 localization to the PM steadily increases until 90 min post release from the ER. (d) The mean intensity of all cells in (c) was normalized to the respective no biotin controls. (e) The percentage of cells expressing RUSH-APOL1 at the PM was determined using a threshold set by untransfected wells, and then normalized to the respective no biotin controls. For analysis of (d) and (e), a generalized linear model was used to make pairwise comparisons between all samples. Comparisons were performed between biotin treated and untreated cells within each respective genotype. All data are represented as mean ± s.d. (a–b) Scale bars = 10 µm.


