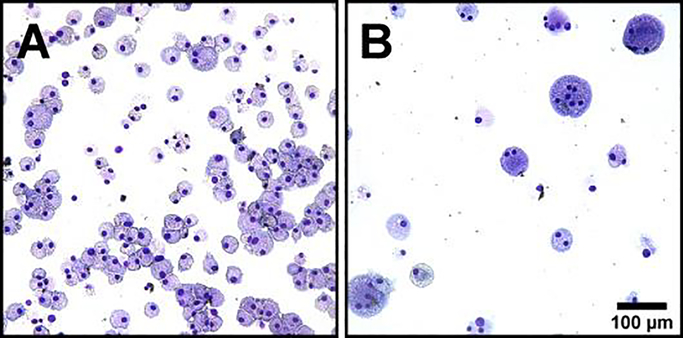
Fig. 1. Enrichment by microfiltration.
Representative images of purified cell populations resulting from microfiltration separation. (A) Cells that passed through the filter were macrophage-enriched. (B) Cells blocked by the filter were MGC-enriched. After filtration, cell concentrations were adjusted to seed 96-well plates with equal numbers of nuclei/well for subsequent experiments. Scale is same for both images, bar 100 μm.

