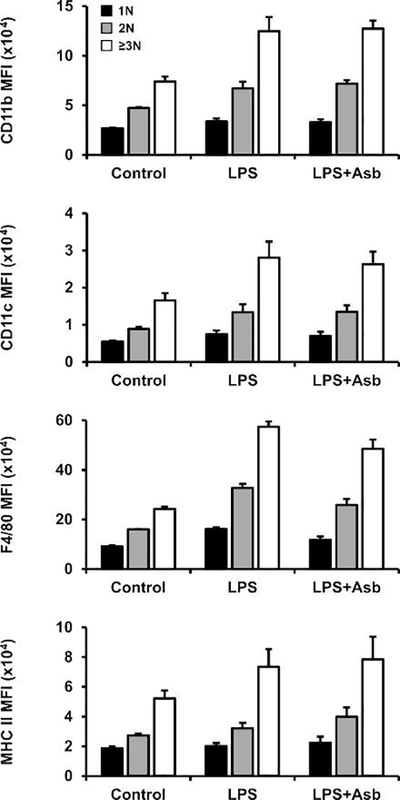
Fig. 2. Surface markers before normalization.

Cells were gated according to nuclear fluorescence into three groups: one nucleus (1N; black bars), two nuclei (2N; gray), and three or more nuclei (≥3N; white). Median fluorescence intensity (MFI) of all surface markers increases in binucleated macrophages (2N) and MGC (≥3N), which may lead to the conclusion that marker expression is increased in these cells. However, the increase in fluorescence may simply be a result of larger cell size, with actual membrane density distribution of markers remaining unchanged. This demonstrates the importance of data normalization.
