
Fig. 3. Surface markers after normalization.
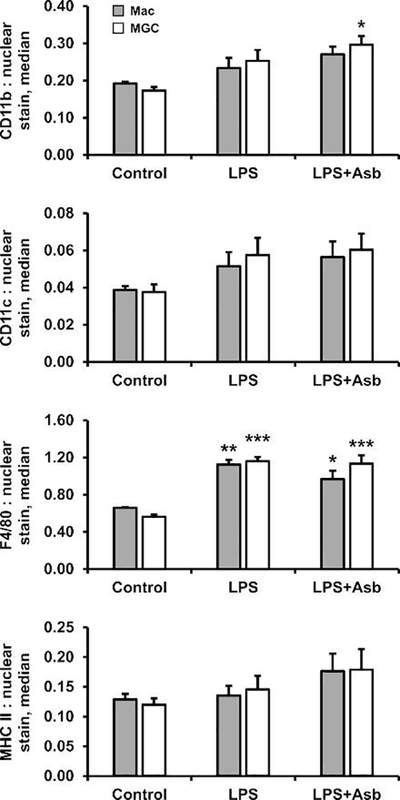
Normalized protein expression by macrophages (gray bars) and MGC (white bars) that were unstimulated (control) or stimulated with LPS or LPS plus asbestos for 24 h. No significant differences in surface markers were observed between macrophages and MGC. Asterisks(*) indicate significant treatment effects versus corresponding cell-type control.