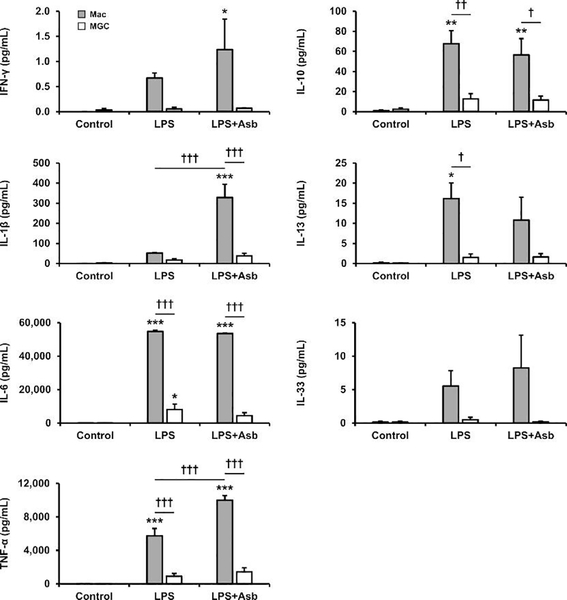
Fig. 4. Cytokine secretion.
Supernatant protein concentrations from enriched populations of macrophages (gray bars) and MGC (white bars) that were unstimulated (control) or stimulated with LPS or LPS plus asbestos for 24 h. The immunoassay included cytokines generally associated with classical (M1; left column) and alternative (M2; right column) activation. Asterisks(*) indicate significant treatment effects versus corresponding cell-type control. Daggers(†) indicate other significant contrasts as shown by bars.

