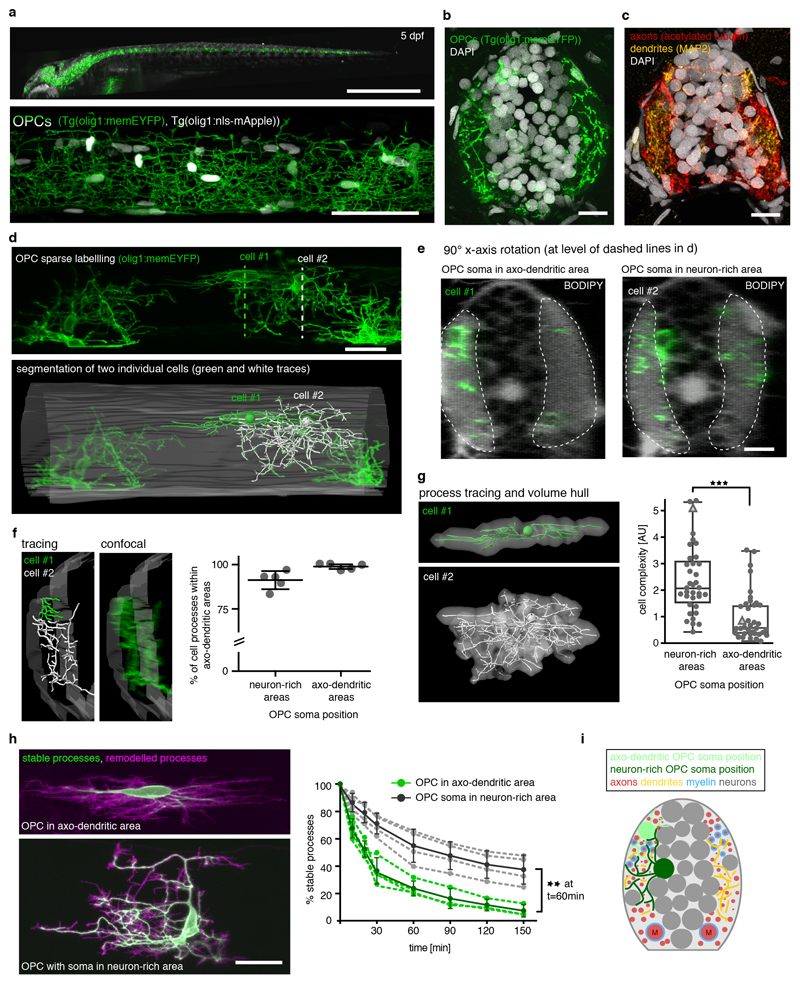
Figure 1. Characteristics of oligodendrocyte precursor cells (OPCs) in zebrafish.
a) Top: Image of whole Tg(olig1:memEYFP) transgenic animal at 5 days post-fertilization (dpf). Scale bar: 1mm. Bottom: confocal image of a Tg(olig1:memEYFP), Tg(olig1:nls-mApple) zebrafish at the level of the spinal cord at 5 dpf. Scale bar: 50 μm. Representative images from 4 animals in 2 independent experiments.
b) Cross-sectional view of the spinal cord showing the distribution of OPC processes in Tg(olig1:memEYFP) at 7 dpf (n=33 animals / 11 experiments). Scale bar: 10 μm.
c) Cross-sectional view of the spinal cord showing the distribution of axons and dendrites at 7 dpf (anti-acetylated tubulin and anti-MAP2; n=7 animals / 2 experiments). Scale bar: 10 μm.
d) Top: sparse labelling of olig1:memEYFP expressing OPCs at 4 dpf. Bottom: Tracing of two neighbouring examplary OPCs and the spinal cord outlines (n numbers in panel g). Dotted lines indicate the position of the y-axis rotations shown in e.
e) 90° y-axis rotations at the level of the soma of each of the two cells shown in panel d with a BODIPY counterstain to reveal the position of OPC somata in axo-dendritic (cell #1) and neuron-rich (cell#2) regions (n=12 BODIPY stained animals / 4 experiments). Dotted lines indicate axo-dendritic areas. Scale bar: 10 μm.
f) High-magnification view showing the proximity of the processes made by the two OPCs shown in panel d within axo-dendritic areas. Quantification shows the percentage of cell processes resident in axo-dendritic areas formed by OPCs with their soma in neuron-rich and axo-dendritic regions at 4-5 dpf (mean 91.3% ± 2.3 SD neuron-rich vs. 98.9% ± 0.7 SD axo-dendritic; n=5 cells/condition from 6 animals).
g) Morphology reconstructions of the two OPCs shown in panels d-f. Quantification shows relative cell complexities of individual OPCs at 4 dpf with their soma in different areas. Triangles indicate example cell#1 and #2. Data are expressed as median ± 25/75% interquartile percentiles, whiskers indicate min/max values (2.1±1.5/3.2 for OPCs in neuron-rich areas vs. 0.6±0.4/1.5 in axo-dendritic areas, p<0.001 (Mann-Whitney U test, U=211; n=36/38 cells from 23 animals in 11 experiments).
h) Projections of 60 minutes time-lapse imaging to show remodelled and stable processes of OPCs with their soma in different areas. Quantification shows stable processes over time. Dashed lines connect data points of individual cells. Data points connected by continuous lines represent mean ± SD within the groups. At t=60 minutes: 56.3±12.2 % stable processes for OPCs in neuron-rich areas vs. 25.0±5.5 % in axo-dendritic areas; p=0.001 between groups (two-way repeated-measures ANOVA of time-points 0-60 min, F(1,6)=32); n=4 cells per group from 8 animals in 8 experiments). Scale bar: 20 μm.
i) Schematic overview depicting the positioning of OPCs in the zebrafish spinal cord.

