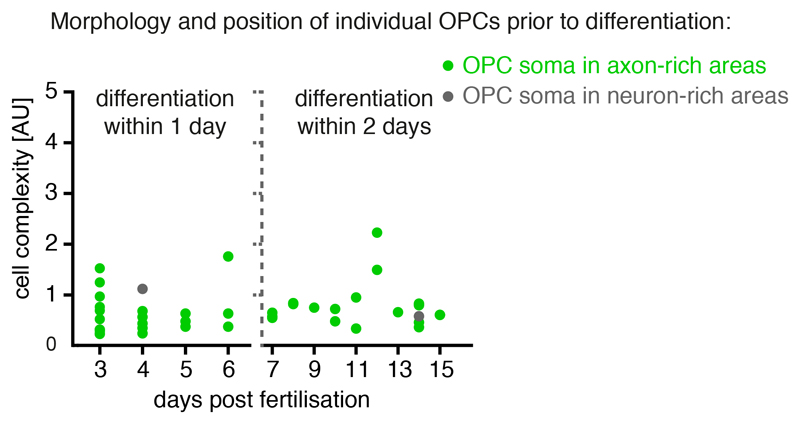
Extended Data Fig. 3. Quantification of OPC morphology and position prior to differentiation.
Quantification OPC complexity and soma position from imaging timelines between 3 and 15 dpf. Measured is the last timepoint as OPC prior to differentiation, as assessed by myelin sheath formation (imaging intervals of 1d between 3 and 7 dpf, and 2d between 7 and 15 dpf). N=10/6/3/3/3/2/1/2/2/2/1/5/1 cells at 3/4/5/6/7/8/9/10/11/12/13/14/15 dpf. Data from 23 animals in 6 experiments.

