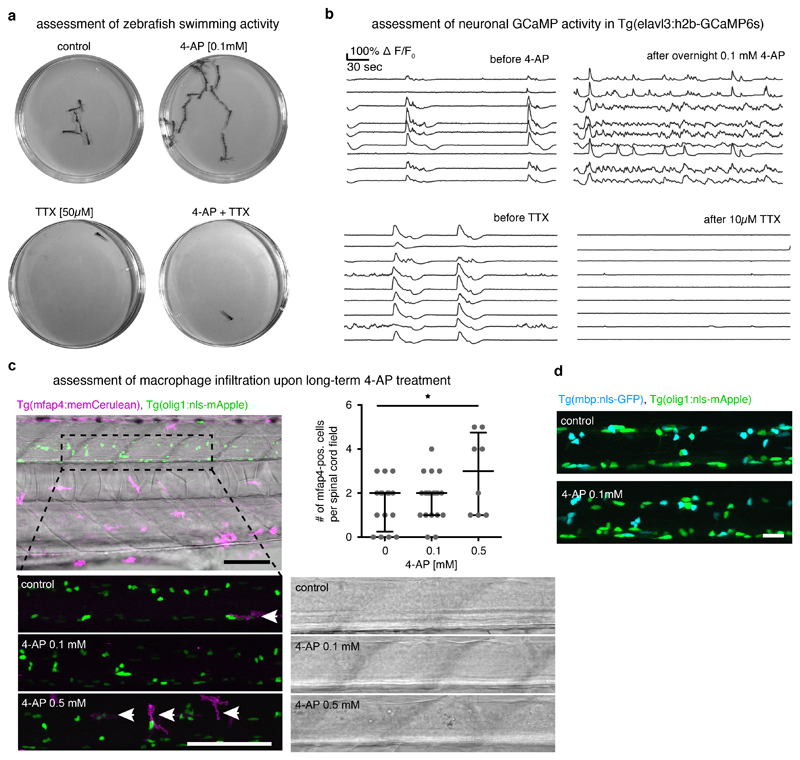
Extended Data Fig. 7. Effects of chronic 4-AP incubation on zebrafish.
a) Minimum intensity projections of a two-minute time-lapse of fish freely swimming in a 3 cm petri dish in different treatment conditions (n=6/7/3/3 animals in control/4-AP/TTX/4-AP+TTX, 3 independent experiments).
b) Traces of GCaMP transients Tg(elavl3:h2b-GCaMP6s) zebrafish at 4 dpf and after overnight incubation in 0.1 mM 4-AP, and before / after 10 μM TTX (7 animals per conditions in 2 experiments).
c) Confocal images of Tg(mfap4:memCerulean), Tg(olig1:nls-mApple) zebrafish at 4 dpf after treatment with 0.1 mM 4-AP, 0.5 mM 4-AP, or Danieau’s solution as control. Transmitted light images to show spinal cord morphology and tissue integrity following drug treatment. Scale bars: 100 μm. The graph shows that number of macrophages which accumulate in 400 μM length of spinal cord of Tg(mfap4:memCerulean) zebrafish after 1 day of control (2±0.25/2 cells), 0.1 mM (2±1/2 cells), and 0.5 mM (3±0.25/2 cells) 4-AP treatment (median (25%/75% percentiles); p=0.43 (control vs. 0.1mM 4-AP), p=0.03 (control vs. 0.5 mM 4-AP) (Kruskal-Wallis test, test statistic=3.003), n=16/19/8 animals in 3 experiments.
d) Representative images of Tg(mbp:nls-EGFP), Tg(olig1:nls-mApple) zebrafish in control and after 2 days of 0.1 mM 4-AP treatment (see Fig 7g for n numbers). Scale bar: 20 μm.

