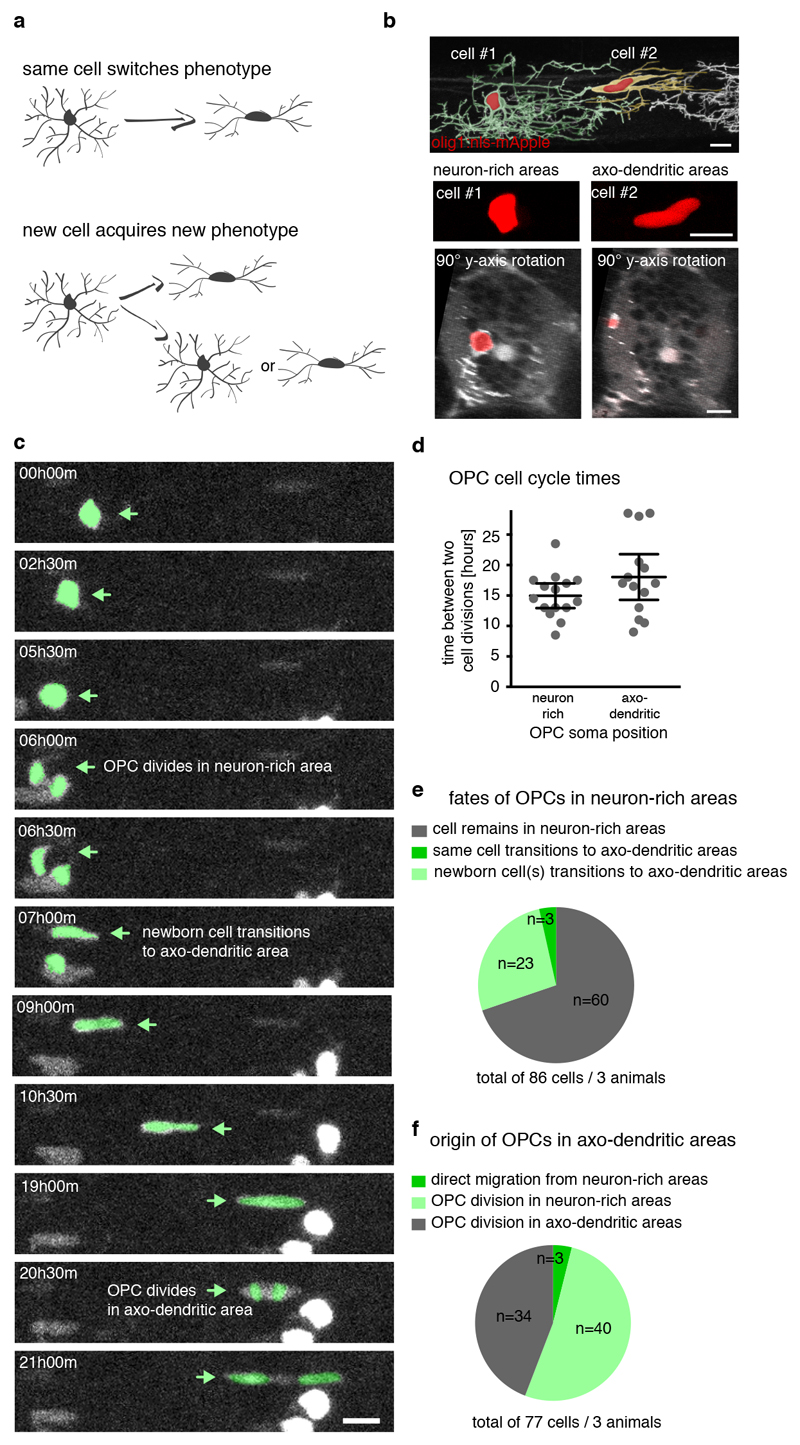
Figure 4. Interrelationships between OPC populations.
a) Schematic overview delineating possible scenarios of OPC interrelations.
b) Example image of two neighbouring OPCs showing that OPCs with their soma in neuron-rich (cell #1) and axo-dendritic areas (cell #2) can be distinguished by the shape of their cell body (n>10 animals / >3 experiments). Scale bar: 10 μm.
c) Selection of time-lapse images over 21 hours acquired at 30 minutes intervals in Tg(mbp:nls-EGFP), Tg(olig1:nls-mApple) zebrafish at 3 dpf showing an OPC division in neuron-rich areas that gives rise to a daughter OPC in axo-dendritic areas, followed by another cell division (n=3 animals / 2 experiments). Scale bar: 10 μm.
d) Times between two cell divisions by OPCs with their soma in neuron-rich and axo-dendritic areas as shown in panel c. Data expressed as mean ± 95% confidence interval (15.0±0.9 hours vs. 18.0±1.7 hours, n=15/14 cells from 3 animals in 2 experiments).
e) Quantification of the fates of OPCs found in neuron-rich areas as shown in panel c (n=86 cells from 3 animals in 2 experiments).
f) Quantification of the origin of OPCs found in axo-dendritic areas as shown in panel c (n=77 cells from 3 animals in 2 experiments).

