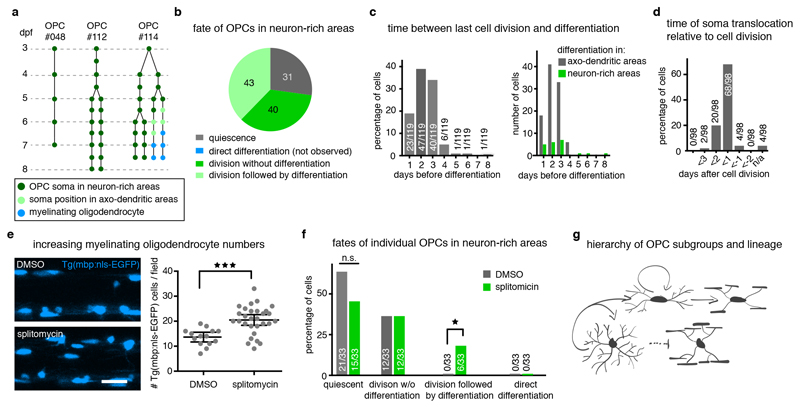
Figure 5. Long-term contribution to myelinating oligodendrocytes through proliferation-mediated generation of new OPCs.
a) Example trees of OPC fates with their cell body in neuron-rich areas (n=114 starting cells from 45 fish of 9 experiments between 3 and 26 dpf, which expanded to 270 cells of which 119 differentiated, see also Extended Data Fig. 5b and Supplementary Fig. 2).
b) Frequency distribution of proliferation and differentiation events observed by individual OPCs in neuron-rich areas over at least 4 days, unless all cells of this clone differentiated earlier (n=114 cells, see panel a).
c) Quantification of the time between last cell division prior to OPC differentiation as percentage for all cells analysed (left) and as absolute numbers for cells with their cell body in neuron-rich and axo-dendritic areas (right) (n=119 cells, see panel a).
d) Quantification of the timing of cell body translocation from neuron-rich to axon-rich areas relative to a cell division (n=98 cells, see panel a).
e) Representative images and quantification of increased oligodendrocyte differentiation at 4 dpf upon splitomicin treatment. Data shown as mean ± 95% confidence interval (13.6±0.9 cells/field vs. 20.4±1.0 cells/field, p<0.001 (two-tailed unpaired t-test, t=4.184, df=41), n=14/29 animals / 4 experiments). Scale bar: 20 μm.
f) Fates of OPCs in neuron-rich areas between 3-5 dpf in presence and absence of splitomicin (control vs. splitomicin: 64% (21/33) vs. 45% (15/33) quiescent, p=0.22 (two-tailed Fisher’s exact test); 0% (0/33) vs. 18% (6/33) differentiation following division, p= 0.02 (two-tailed Fisher’s exact test); n=23 animals per group / 6 experiments).
g) Schematic representing the fates of OPCs following a cell division event.

