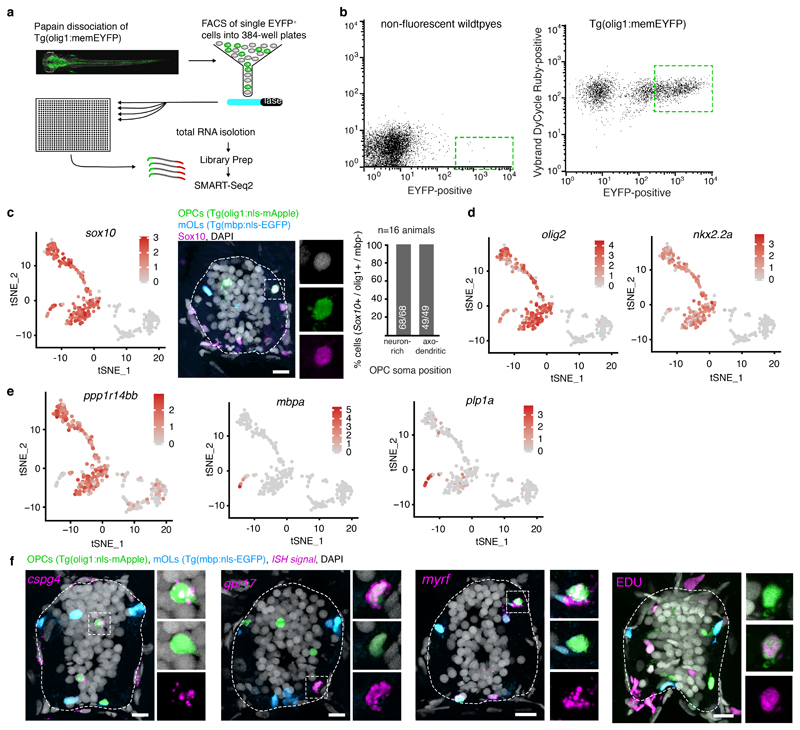
Extended Data Fig. 2. Analysis of scRNA sequencing clusters.
a) Schematic overview of cell isolation, sorting and sequencing.
b) Flow cytometry plots of olig1:memEYFP-sorted cells and wildtype control animals. Dotted lines indicate the gating used (example from two independent experiments).
c) TSNE plot showing expression of sox10 (total sample size n=310 cells). Immunohistochemistry for Sox10 on transversal spinal cord sections of 7 dpf Tg(olig1:nls-mApple), Tg(mbp:nls-EGFP) animals and quantification of Sox10-expressing OPCs (olig1:nls-mApple-positive, mbp:nls-EGFP-negative) in neuron-rich and axo-dendritic areas (100% (68/68) vs 100% (49/49) pos cells, n=16 animals / 4 experiments). Dotted lines in the image indicate the outlines of the spinal cord. Scale bar:10 μm.
d) TSNE plot showing expression of olig2 and nkx2.2a (sample size as in panel c).
e) TSNE plot showing expression of ppp1r14bb, mbpa, and plp1a (sample size as in panel c).
f) Confocal images with in situ hybridisations for cspg4, gpr17, myrf, and labelling of EDU incorporated cells on transversal spinal cord sections of 7 dpf Tg(olig1:nls-mApple), Tg(mbp:nls-EGFP) animals (see Fig. 2e, 2i, 2k, 2l for respective n numbers). Scale bar: 10 μm.

