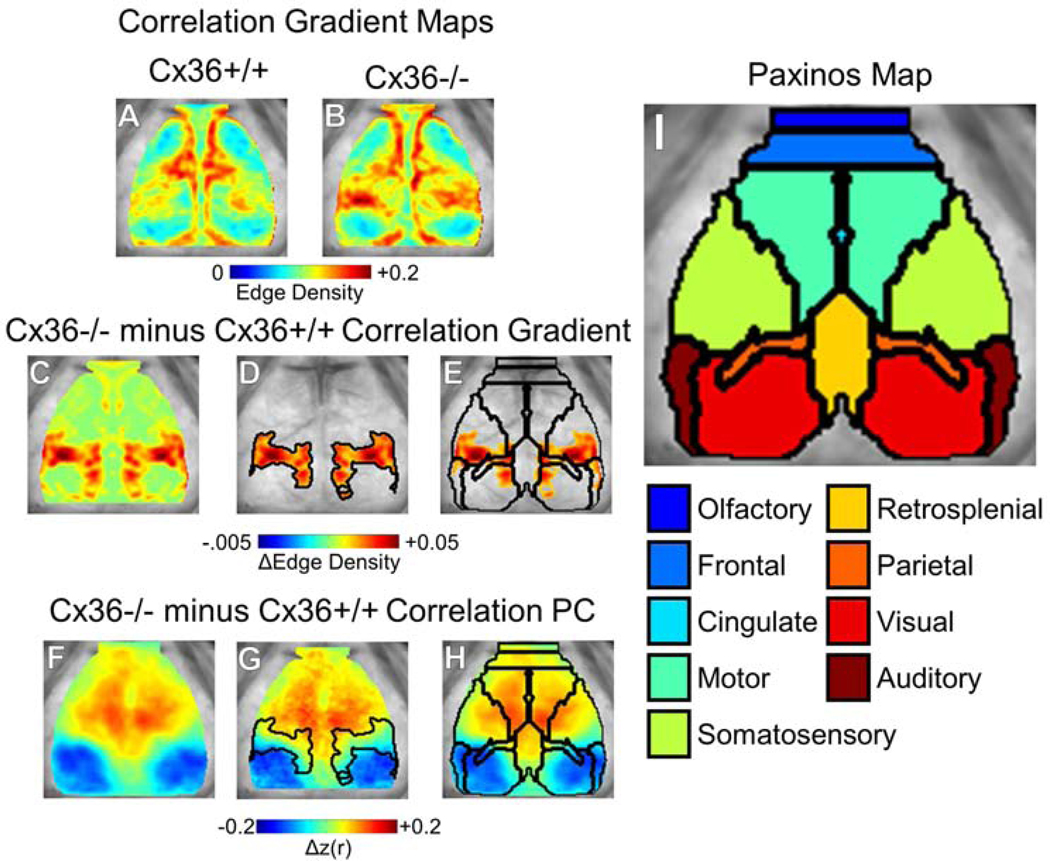
Figure 4.
Cx36 deletion caused a wider anterior-posterior correlation transition gradient. (A–B) Correlation gradient maps for (A) Cx36+/+ mice and (B) Cx36−/− mice. The brain space is smaller compared to Fig. 1–3 because gradient values are not calculated at the edge. (C) Cx36−/− minus Cx36+/+ gradient difference map revealed a focally increased correlation transition gradient on the anterior-posterior axis. (D) Threshold-masked and outlined gradient differences. (E) Thresholded gradient differences shown with overlaid Paxinos anatomy demonstrated that these gradient differences occur at the border of several anatomical regions separated on the anterior-posterior axis. (F) The Δcorrelation PC determined from PCA on correlation differences between all mice analyzed. This Δcorrelation PC was similar to the Δcorrelation PC found in a subset of mice in Fig. 1F. Δcorrelation PC with overlaid (G) correlation gradient differences and (H,I) Paxinos anatomical boundaries and atlas for reference. Cx36+/+ n=19, Cx36−/− n=13.

