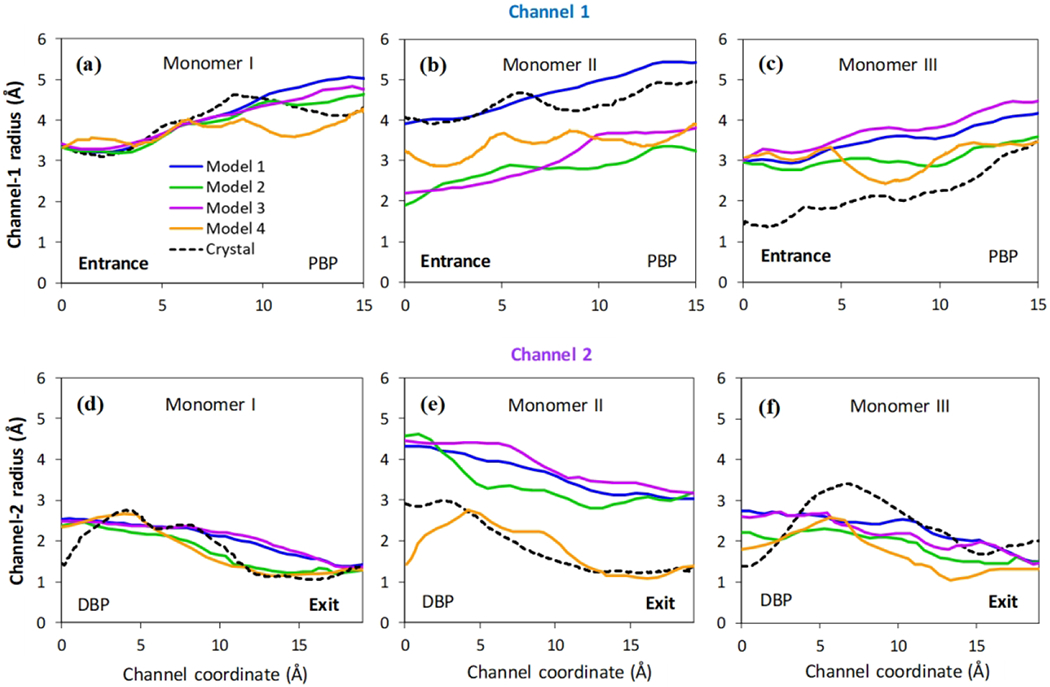
Figure 7.

Pore radius profiles. The pore radius profiles calculated by CAVER 2.06 for channel 1 (a, b and c) and channel 2 (d, e and f) of all three monomers for four models considered here. Solid lines present the averages from 100 frames of the last 100 ns simulations and three independent realizations. The pore radius profiles from the original crystal structure (PDB ID: 2DHH) are also included as black dash lines for comparison.
